## Line Chart: RMSE vs. n for Different Algorithms
### Overview
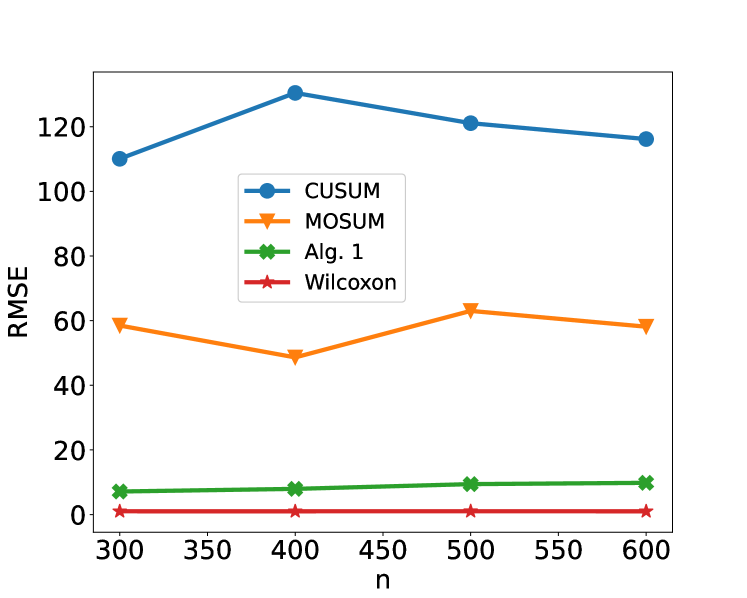
The image is a line chart comparing the Root Mean Squared Error (RMSE) of four different algorithms (CUSUM, MOSUM, Alg. 1, and Wilcoxon) as a function of 'n'. The x-axis represents 'n', and the y-axis represents RMSE.
### Components/Axes
* **Title:** There is no explicit title on the chart.
* **X-axis:**
* Label: "n"
* Scale: 300 to 600, with markers at 300, 400, 500, and 600.
* **Y-axis:**
* Label: "RMSE"
* Scale: 0 to 120, with implicit markers every 20 units.
* **Legend:** Located on the right side of the chart.
* CUSUM (blue line with circle markers)
* MOSUM (orange line with triangle markers)
* Alg. 1 (green line with 'x' markers)
* Wilcoxon (red line with star markers)
### Detailed Analysis
* **CUSUM (blue):** The line starts at approximately 110 at n=300, increases to approximately 130 at n=400, and then decreases to approximately 120 at n=500 and approximately 117 at n=600.
* (300, 110)
* (400, 130)
* (500, 120)
* (600, 117)
* **MOSUM (orange):** The line starts at approximately 60 at n=300, decreases to approximately 48 at n=400, increases to approximately 63 at n=500, and decreases slightly to approximately 59 at n=600.
* (300, 60)
* (400, 48)
* (500, 63)
* (600, 59)
* **Alg. 1 (green):** The line remains relatively flat, starting at approximately 7 at n=300, increasing slightly to approximately 9 at n=500, and then increasing slightly to approximately 10 at n=600.
* (300, 7)
* (400, 8)
* (500, 9)
* (600, 10)
* **Wilcoxon (red):** The line remains relatively flat and close to zero.
* (300, 1)
* (400, 1)
* (500, 1)
* (600, 1)
### Key Observations
* CUSUM has the highest RMSE values overall.
* MOSUM has a fluctuating RMSE, decreasing initially and then increasing.
* Alg. 1 and Wilcoxon have significantly lower RMSE values compared to CUSUM and MOSUM.
* Wilcoxon has the lowest RMSE values, close to zero across all 'n' values.
### Interpretation
The chart compares the performance of four algorithms based on their RMSE as 'n' varies. CUSUM performs the worst, with the highest RMSE. MOSUM's performance fluctuates. Alg. 1 and Wilcoxon perform significantly better, with Wilcoxon showing the best performance, indicated by its consistently low RMSE values. The data suggests that for the range of 'n' values considered, Wilcoxon is the most accurate algorithm, followed by Alg. 1. CUSUM is the least accurate. The specific meaning of 'n' is not provided, but it is likely a parameter or input size affecting the algorithms' performance.