## Line Chart: RMSE vs. n for Different Algorithms
### Overview
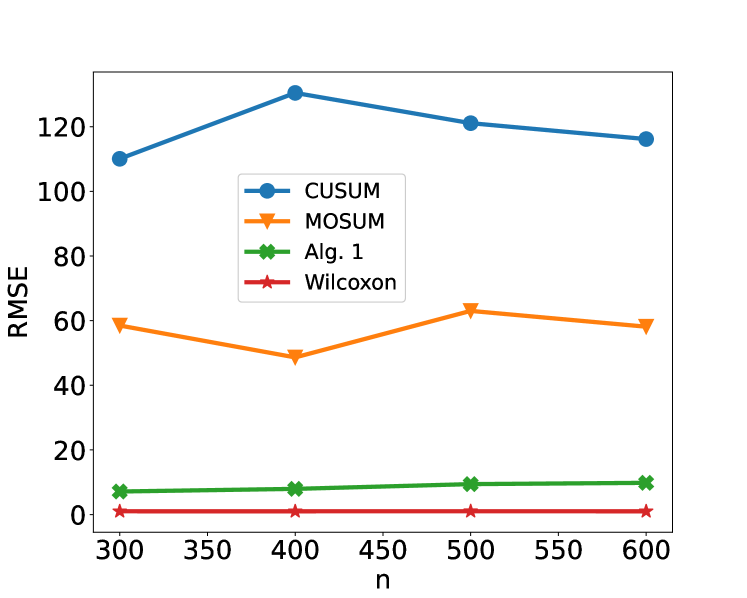
This image displays a line chart comparing the Root Mean Squared Error (RMSE) for four different algorithms (CUSUM, MOSUM, Alg. 1, and Wilcoxon) across varying values of 'n'. The x-axis represents 'n', and the y-axis represents RMSE.
### Components/Axes
* **Chart Type**: Line Chart
* **Title**: Implicitly, the chart shows the performance of different algorithms based on RMSE as a function of 'n'.
* **X-axis Label**: 'n'
* **X-axis Markers**: 300, 350, 400, 450, 500, 550, 600
* **Y-axis Label**: 'RMSE'
* **Y-axis Markers**: 0, 20, 40, 60, 80, 100, 120
* **Legend**: Located in the top-right quadrant of the chart.
* **CUSUM**: Represented by a blue line with circular markers.
* **MOSUM**: Represented by an orange line with triangular markers.
* **Alg. 1**: Represented by a green line with 'x' shaped markers.
* **Wilcoxon**: Represented by a red line with star shaped markers.
### Detailed Analysis or Content Details
**Data Series Trends and Points:**
1. **CUSUM (Blue Line with Circles):**
* **Trend**: The CUSUM line generally slopes upward from n=300 to n=400, reaching a peak, and then slopes downward slightly for larger values of n.
* **Data Points (approximate):**
* n=300: RMSE ≈ 110
* n=400: RMSE ≈ 128
* n=500: RMSE ≈ 120
* n=600: RMSE ≈ 116
2. **MOSUM (Orange Line with Triangles):**
* **Trend**: The MOSUM line shows a decrease in RMSE from n=300 to n=400, followed by an increase to n=500, and then a slight decrease to n=600.
* **Data Points (approximate):**
* n=300: RMSE ≈ 60
* n=400: RMSE ≈ 48
* n=500: RMSE ≈ 64
* n=600: RMSE ≈ 59
3. **Alg. 1 (Green Line with 'x' Markers):**
* **Trend**: The Alg. 1 line shows a relatively stable and low RMSE across all observed values of n, with a very slight upward trend.
* **Data Points (approximate):**
* n=300: RMSE ≈ 6
* n=400: RMSE ≈ 7
* n=500: RMSE ≈ 7
* n=600: RMSE ≈ 7
4. **Wilcoxon (Red Line with Stars):**
* **Trend**: The Wilcoxon line maintains a consistently low and stable RMSE across all observed values of n.
* **Data Points (approximate):**
* n=300: RMSE ≈ 2
* n=400: RMSE ≈ 2
* n=500: RMSE ≈ 2
* n=600: RMSE ≈ 2
### Key Observations
* **Alg. 1 and Wilcoxon** consistently exhibit the lowest RMSE values, indicating they are the most accurate or performant algorithms in terms of this metric across the tested range of 'n'. Their RMSE values are very close to zero.
* **CUSUM** shows the highest RMSE values among all algorithms, with a peak around n=400.
* **MOSUM** performs moderately, with RMSE values significantly lower than CUSUM but higher than Alg. 1 and Wilcoxon. Its performance shows some fluctuation with changes in 'n'.
* The trend for CUSUM suggests that its performance might degrade slightly for very large 'n' after an initial increase.
* The trends for Alg. 1 and Wilcoxon are remarkably flat, suggesting robustness to changes in 'n' within the observed range.
### Interpretation
This chart demonstrates the comparative performance of four different algorithms (CUSUM, MOSUM, Alg. 1, and Wilcoxon) as measured by Root Mean Squared Error (RMSE) for varying sample sizes ('n').
The data strongly suggests that **Alg. 1 and Wilcoxon are superior algorithms** for the task represented by this RMSE metric, as they consistently produce the lowest error rates. Their stability across different 'n' values indicates they are reliable.
The **CUSUM algorithm appears to be the least effective**, exhibiting the highest RMSE. The observed peak at n=400 and subsequent slight decrease might suggest a complex relationship between sample size and CUSUM's error, possibly related to its detection mechanism.
The **MOSUM algorithm falls in the middle**, showing a more variable performance than Alg. 1 and Wilcoxon, but still outperforming CUSUM. Its dip in RMSE at n=400 and rise at n=500 could indicate specific sample sizes where it is more or less effective.
In essence, the chart provides evidence for selecting Alg. 1 or Wilcoxon for applications where minimizing RMSE is critical, while CUSUM should be approached with caution, and MOSUM offers a compromise with some variability. The choice of algorithm would depend on the specific requirements of the application, balancing accuracy (RMSE) with other potential factors not shown here (e.g., computational cost, interpretability).