## Line Chart: RMSE vs. n for Change Detection Algorithms
### Overview
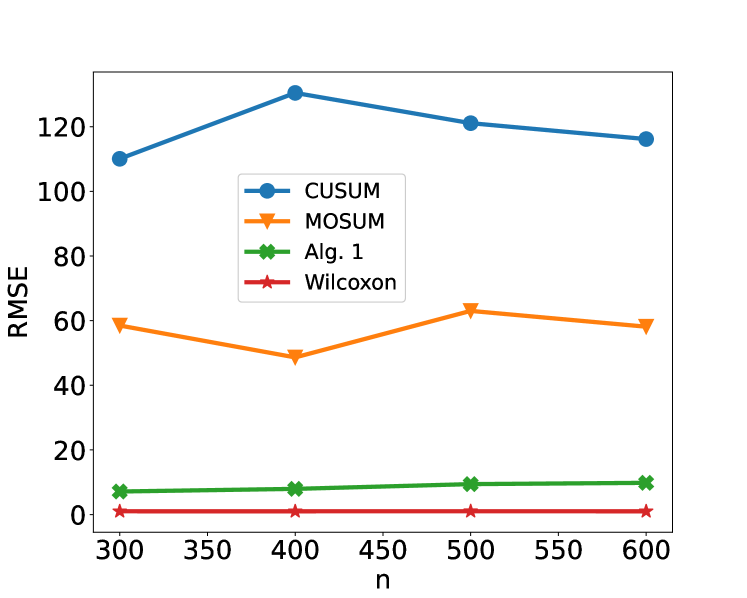
This image presents a line chart comparing the Root Mean Squared Error (RMSE) performance of four change detection algorithms – CUSUM, MOSUM, Alg. 1, and Wilcoxon – as a function of the sample size 'n'. The chart visually assesses how the accuracy of each algorithm changes with increasing data points.
### Components/Axes
* **X-axis:** 'n' - Sample Size, ranging from approximately 300 to 600, with markers at 300, 350, 400, 450, 500, 550, and 600.
* **Y-axis:** 'RMSE' - Root Mean Squared Error, ranging from 0 to 130, with markers at 0, 20, 40, 60, 80, 100, and 120.
* **Legend:** Located in the top-right corner, identifying the four algorithms:
* CUSUM (Blue circles)
* MOSUM (Orange triangles)
* Alg. 1 (Green stars)
* Wilcoxon (Red crosses)
### Detailed Analysis
* **CUSUM (Blue):** The line starts at approximately 105 at n=300, increases to a peak of approximately 130 at n=400, and then decreases to approximately 118 at n=600. This indicates that CUSUM performs worst around n=400.
* **MOSUM (Orange):** The line begins at approximately 58 at n=300, decreases to a minimum of approximately 45 at n=350, and then increases to approximately 55 at n=600. MOSUM shows a slight improvement initially, then a gradual decline in performance.
* **Alg. 1 (Green):** The line is relatively flat, starting at approximately 8 at n=300 and ending at approximately 10 at n=600. It fluctuates slightly around this level.
* **Wilcoxon (Red):** The line is nearly flat, starting at approximately 2 at n=300 and remaining close to this value (approximately 3) throughout the range of 'n' up to n=600.
Here's a table summarizing the approximate RMSE values for each algorithm at each 'n' value:
| n | CUSUM | MOSUM | Alg. 1 | Wilcoxon |
| --- | ----- | ----- | ------ | -------- |
| 300 | 105 | 58 | 8 | 2 |
| 350 | 115 | 45 | 7 | 2 |
| 400 | 130 | 48 | 9 | 2 |
| 450 | 125 | 52 | 8 | 3 |
| 500 | 122 | 57 | 10 | 3 |
| 550 | 120 | 60 | 9 | 3 |
| 600 | 118 | 55 | 10 | 3 |
### Key Observations
* Wilcoxon consistently exhibits the lowest RMSE values across all sample sizes.
* Alg. 1 maintains a low and stable RMSE, slightly higher than Wilcoxon.
* CUSUM shows the highest RMSE values and the most significant fluctuation with changing 'n'.
* MOSUM's RMSE is intermediate, showing a slight initial improvement followed by a gradual increase.
* The performance difference between Wilcoxon and the other algorithms becomes more pronounced as 'n' increases.
### Interpretation
The chart demonstrates the comparative effectiveness of different change detection algorithms as the sample size grows. Wilcoxon appears to be the most robust algorithm, consistently providing the lowest error rates regardless of the sample size. Alg. 1 also performs well, maintaining a low error rate. CUSUM, however, is sensitive to the sample size, exhibiting a peak in RMSE around n=400, suggesting it may be less reliable for certain data volumes. MOSUM's performance is moderate, showing a slight initial improvement but ultimately increasing with 'n'.
The consistent low RMSE of Wilcoxon suggests it is a good choice for change detection tasks, particularly when dealing with larger datasets. The fluctuating RMSE of CUSUM indicates that its performance is more dependent on the specific characteristics of the data and the sample size. The chart highlights the importance of selecting an appropriate algorithm based on the expected data volume and the desired level of accuracy. The data suggests that as the sample size increases, the advantage of using Wilcoxon over the other algorithms becomes more significant.