\n
## Line Chart: RMSE Comparison of Four Methods Across Sample Sizes (n)
### Overview
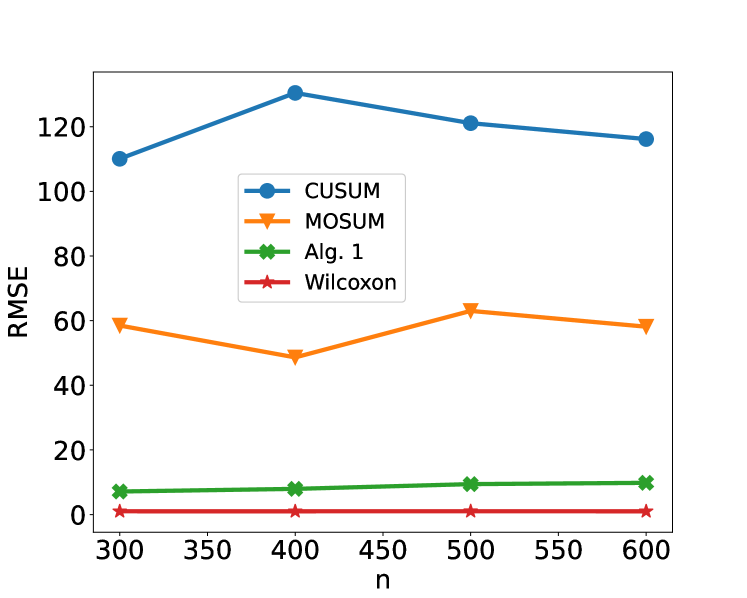
The image displays a line chart comparing the Root Mean Square Error (RMSE) of four different statistical or algorithmic methods as a function of sample size, denoted by `n`. The chart illustrates how the performance (error) of each method changes as the amount of data increases from 300 to 600 samples.
### Components/Axes
* **Chart Type:** Multi-line chart with markers.
* **X-Axis:**
* **Label:** `n` (representing sample size).
* **Scale:** Linear, ranging from 300 to 600.
* **Major Tick Marks:** 300, 350, 400, 450, 500, 550, 600.
* **Y-Axis:**
* **Label:** `RMSE` (Root Mean Square Error).
* **Scale:** Linear, ranging from 0 to approximately 130.
* **Major Tick Marks:** 0, 20, 40, 60, 80, 100, 120.
* **Legend:**
* **Position:** Center-left of the plot area, slightly overlapping the data lines.
* **Content:** Four entries, each with a unique color, marker, and label.
1. **Blue line with circle markers:** `CUSUM`
2. **Orange line with downward-pointing triangle markers:** `MOSUM`
3. **Green line with 'X' (cross) markers:** `Alg. 1`
4. **Red line with star markers:** `Wilcoxon`
### Detailed Analysis
Data points are approximate, read from the chart's grid.
**1. CUSUM (Blue, Circles):**
* **Trend:** Increases to a peak at n=400, then gradually decreases.
* **Data Points:**
* n=300: RMSE ≈ 110
* n=400: RMSE ≈ 130 (Peak)
* n=500: RMSE ≈ 120
* n=600: RMSE ≈ 115
**2. MOSUM (Orange, Triangles):**
* **Trend:** Fluctuates; dips at n=400, peaks at n=500.
* **Data Points:**
* n=300: RMSE ≈ 60
* n=400: RMSE ≈ 50 (Local minimum)
* n=500: RMSE ≈ 65 (Local maximum)
* n=600: RMSE ≈ 60
**3. Alg. 1 (Green, Crosses):**
* **Trend:** Very slight, steady increase; nearly flat.
* **Data Points:**
* n=300: RMSE ≈ 8
* n=400: RMSE ≈ 9
* n=500: RMSE ≈ 10
* n=600: RMSE ≈ 10
**4. Wilcoxon (Red, Stars):**
* **Trend:** Essentially flat and constant at a very low value.
* **Data Points:**
* n=300: RMSE ≈ 1
* n=400: RMSE ≈ 1
* n=500: RMSE ≈ 1
* n=600: RMSE ≈ 1
### Key Observations
1. **Performance Hierarchy:** There is a clear and consistent separation in performance. `Wilcoxon` has the lowest error by a large margin, followed by `Alg. 1`, then `MOSUM`, with `CUSUM` exhibiting the highest error across all sample sizes.
2. **Stability:** `Wilcoxon` and `Alg. 1` show highly stable performance (low variance) as `n` increases. `MOSUM` shows moderate fluctuation, while `CUSUM` shows the most significant change in error with sample size.
3. **Peak Error:** The `CUSUM` method's error peaks at the intermediate sample size of n=400 before improving slightly.
4. **Scale Difference:** The RMSE values for `CUSUM` and `MOSUM` are an order of magnitude larger than those for `Alg. 1` and `Wilcoxon`.
### Interpretation
This chart likely compares the accuracy of different change-point detection algorithms or statistical tests (`CUSUM`, `MOSUM`, a proposed `Alg. 1`, and the `Wilcoxon` rank-sum test) in estimating a parameter or detecting a shift, where RMSE measures the estimation error.
* **What the data suggests:** The `Wilcoxon` method is vastly superior in terms of accuracy (lowest RMSE) for this specific task and is unaffected by the sample sizes tested. `Alg. 1` also performs very well and stably. The traditional `CUSUM` and `MOSUM` methods have significantly higher errors, suggesting they may be less suitable for the underlying data generating process or the specific metric being measured here.
* **Relationship between elements:** The chart directly contrasts established methods (`CUSUM`, `MOSUM`, `Wilcoxon`) with a new one (`Alg. 1`). The visual grouping shows `Alg. 1` performing much closer to the robust `Wilcoxon` test than to the other change-point methods.
* **Notable anomalies:** The non-monotonic behavior of `CUSUM` (error increasing then decreasing) is notable. It suggests that for this particular problem, simply increasing sample size does not guarantee improved performance for `CUSUM` within this range, possibly due to model misspecification or sensitivity to certain data characteristics at n=400. The consistently flat line for `Wilcoxon` indicates it is a very robust estimator for this scenario.