# Technical Document Extraction: Line Chart Analysis
## Chart Overview
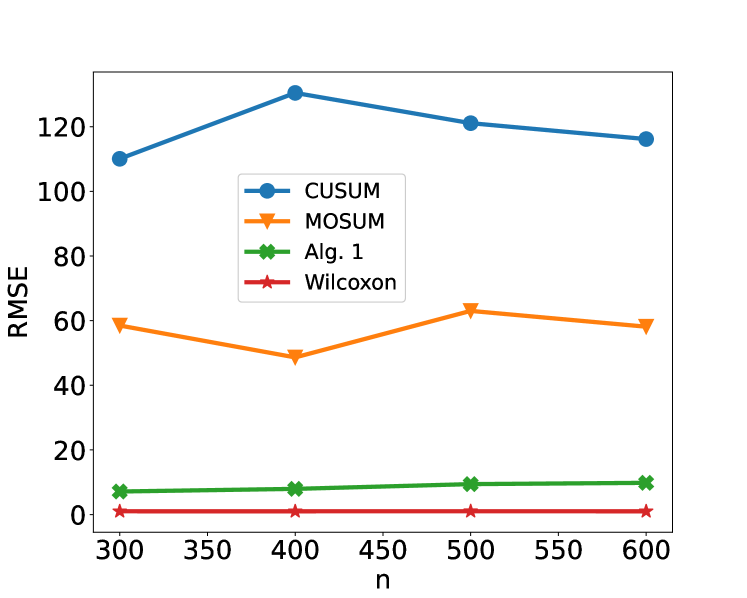
The image is a **line chart** comparing the Root Mean Square Error (RMSE) performance of four statistical algorithms across varying sample sizes (`n`). The x-axis represents sample size (`n`), and the y-axis represents RMSE values. Four data series are plotted with distinct line styles and markers.
---
### **Axis Labels and Markers**
- **X-axis (Horizontal):**
- Label: `n` (sample size)
- Markers: 300, 350, 400, 450, 500, 550, 600
- **Y-axis (Vertical):**
- Label: `RMSE` (Root Mean Square Error)
- Scale: 0 to 140, incrementing by 20
---
### **Legend and Data Series**
The legend is located in the **upper-left corner** of the chart. Each data series is represented by a unique line style, marker, and color:
| **Legend Label** | **Color** | **Marker** | **Line Style** | **Trend Description** |
|-------------------|-----------|------------|----------------|------------------------|
| **CUSUM** | Blue | Circle | Solid | Peaks at `n=400` (~130 RMSE), then declines to ~120 at `n=600`. |
| **MOSUM** | Orange | Triangle | Solid | Dips at `n=400` (~50 RMSE), rises to ~65 at `n=500`, then stabilizes at ~60. |
| **Alg. 1** | Green | Cross | Solid | Gradual upward trend from ~5 to ~10 RMSE. |
| **Wilcoxon** | Red | Star | Solid | Flat line near 0 RMSE throughout. |
---
### **Key Data Points**
1. **CUSUM (Blue Line):**
- `n=300`: ~110 RMSE
- `n=400`: ~130 RMSE (peak)
- `n=500`: ~120 RMSE
- `n=600`: ~115 RMSE
2. **MOSUM (Orange Line):**
- `n=300`: ~60 RMSE
- `n=400`: ~50 RMSE (minimum)
- `n=500`: ~65 RMSE (peak)
- `n=600`: ~60 RMSE
3. **Alg. 1 (Green Line):**
- `n=300`: ~5 RMSE
- `n=400`: ~7 RMSE
- `n=500`: ~9 RMSE
- `n=600`: ~10 RMSE
4. **Wilcoxon (Red Line):**
- Consistent ~0 RMSE across all `n` values.
---
### **Trend Verification**
- **CUSUM** exhibits a **bell-shaped curve**, peaking at `n=400` before declining.
- **MOSUM** shows a **U-shaped trend**, with a trough at `n=400` and a secondary peak at `n=500`.
- **Alg. 1** demonstrates a **linear upward trend**, increasing by ~5 RMSE units over the range.
- **Wilcoxon** remains **constant** near 0 RMSE, indicating minimal error.
---
### **Spatial Grounding**
- **Legend Position:** Upper-left corner (coordinates: `[x=0.1, y=0.9]` relative to chart bounds).
- **Data Point Colors:**
- Blue circles (CUSUM) match legend.
- Orange triangles (MOSUM) match legend.
- Green crosses (Alg. 1) match legend.
- Red stars (Wilcoxon) match legend.
---
### **Additional Notes**
- No embedded text blocks, tables, or non-English content detected.
- All labels, axis titles, and legend entries are in English.
- The chart focuses on **comparative performance analysis** of statistical algorithms.
---
### **Conclusion**
The chart illustrates that **Wilcoxon** consistently performs best (lowest RMSE), while **CUSUM** shows the highest variability. **MOSUM** and **Alg. 1** exhibit moderate performance with distinct trends.