## Circular Workflow Diagram: Continuous Improvement Cycle
### Overview
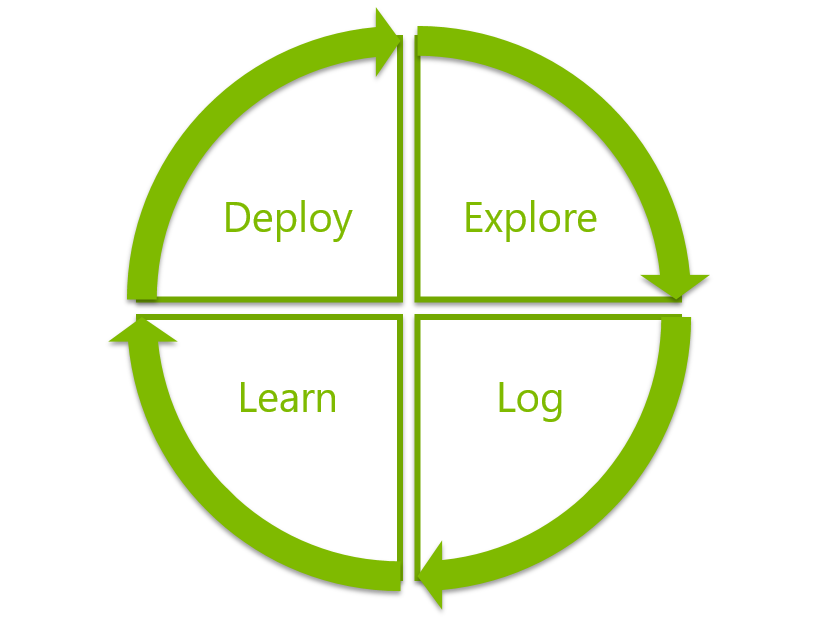
The image depicts a circular workflow diagram with four interconnected quadrants, each labeled with a distinct phase of a cyclical process. The diagram uses green arrows to indicate directional flow between phases, creating a closed-loop system. The background is light gray, with white quadrant sections and green text/arrows.
### Components/Axes
- **Quadrants**: Four equal sections arranged clockwise:
1. **Deploy** (top-left)
2. **Explore** (top-right)
3. **Learn** (bottom-left)
4. **Log** (bottom-right)
- **Arrows**:
- Green directional arrows connect each quadrant to the next in a clockwise sequence.
- No explicit legend or axis titles are present.
- **Color Scheme**:
- Text and arrows: Bright green (#32CD32)
- Background: Light gray (#D3D3D3)
- Quadrant sections: White
### Detailed Analysis
- **Textual Elements**:
- All labels ("Deploy," "Explore," "Learn," "Log") are centered within their respective quadrants.
- Arrows originate from the right edge of each quadrant and point to the left edge of the subsequent quadrant.
- **Spatial Grounding**:
- **Deploy** (top-left) → **Explore** (top-right): Arrow curves upward.
- **Explore** (top-right) → **Learn** (bottom-left): Arrow curves downward.
- **Learn** (bottom-left) → **Log** (bottom-right): Arrow curves upward.
- **Log** (bottom-right) → **Deploy** (top-left): Arrow curves downward, completing the loop.
### Key Observations
1. The diagram emphasizes a **continuous, iterative process** with no defined start/end point.
2. The cyclical nature suggests phases are repeated indefinitely, with output from one phase feeding into the next.
3. The use of green may symbolize growth, progress, or sustainability.
### Interpretation
This diagram likely represents a **methodology for iterative development or problem-solving**, such as:
- **Agile project management**: Deploy (implement), Explore (test), Learn (analyze), Log (document), then repeat.
- **Continuous improvement frameworks**: Each phase builds on the previous, creating feedback loops for refinement.
- **Data-driven workflows**: Logging (data collection) informs learning, which guides exploration and deployment.
The absence of numerical data or explicit metrics suggests the diagram focuses on **process structure** rather than quantitative analysis. The equal weighting of quadrants implies all phases are equally critical to the cycle's success.