\n
## Diagram: Iterative Process Cycle
### Overview
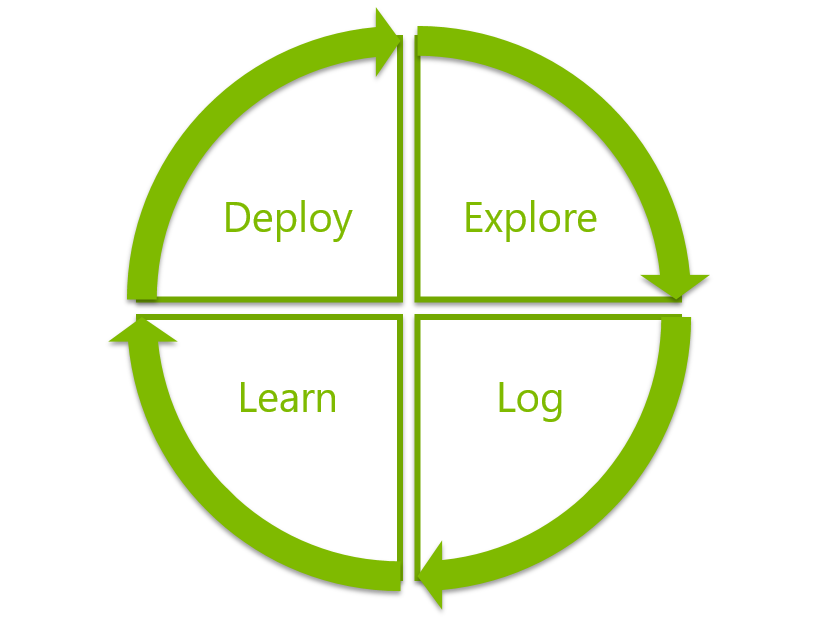
The image depicts a circular diagram illustrating an iterative process cycle. The cycle is divided into four quadrants, each containing a single word representing a stage in the process. Arrows connect the quadrants, indicating the flow of the cycle. The diagram is visually simple, using a light green color scheme against a light gray background.
### Components/Axes
The diagram consists of:
* **Four Quadrants:** Each quadrant contains a stage of the process.
* **Stages:** "Deploy", "Explore", "Log", "Learn".
* **Arrows:** Green arrows connect each stage in a clockwise direction, indicating the cyclical nature of the process.
* **Background:** Light gray.
* **Color Scheme:** Primarily light green.
### Detailed Analysis or Content Details
The diagram presents a four-stage iterative process. The stages, in clockwise order, are:
1. **Deploy:** Located in the top-left quadrant.
2. **Explore:** Located in the top-right quadrant.
3. **Log:** Located in the bottom-right quadrant.
4. **Learn:** Located in the bottom-left quadrant.
The arrows indicate a continuous loop: Deploy -> Explore -> Log -> Learn -> Deploy, and so on. The arrows are consistently green and have arrowheads pointing in the direction of the next stage.
### Key Observations
The diagram emphasizes a cyclical and iterative approach. There are no numerical values or specific data points; it's a conceptual representation of a process. The simplicity of the diagram suggests a high-level overview rather than a detailed breakdown of each stage.
### Interpretation
The diagram illustrates a common iterative process often used in software development, data science, or machine learning. The stages suggest a workflow where a product or model is first *Deployed*, then its performance is *Explored* and data is *Logged*. The collected data is then used to *Learn* and improve the product or model, leading to a new deployment and continuation of the cycle. This cycle highlights the importance of continuous improvement and adaptation based on real-world data and feedback. The diagram's simplicity suggests that this is a foundational model, and each stage could be further broken down into more detailed steps. The cyclical nature emphasizes that this is not a one-time process but an ongoing effort.