## Venn Diagram: Overlap Analysis of BPE, PathPiece-initBPE, and SaGe-initBPE
### Overview
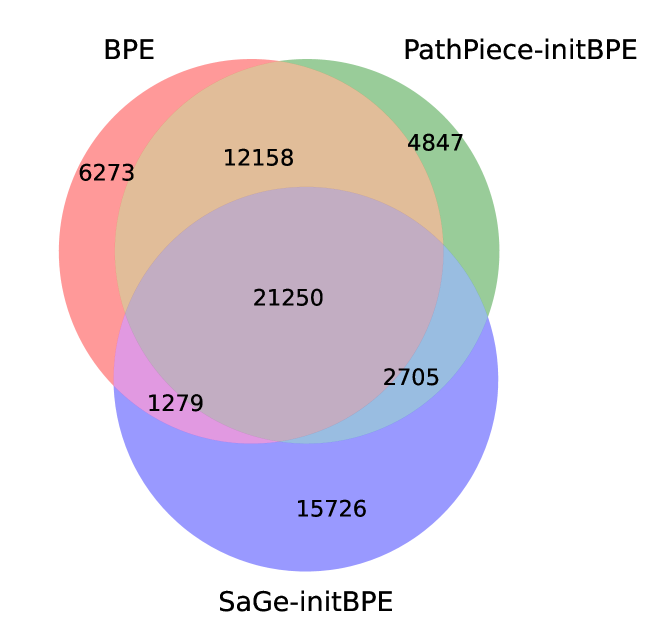
The image is a three-circle Venn diagram comparing three datasets: **BPE** (red), **PathPiece-initBPE** (green), and **SaGe-initBPE** (blue). Numerical values are embedded in each region to quantify overlaps and unique elements. The diagram uses color-coded regions to represent intersections and exclusions.
### Components/Axes
- **Circles**:
- **BPE** (Red): Leftmost circle.
- **PathPiece-initBPE** (Green): Top-right circle.
- **SaGe-initBPE** (Blue): Bottom-right circle.
- **Overlap Regions**:
- **BPE ∩ PathPiece-initBPE**: 12,158 (orange).
- **PathPiece-initBPE ∩ SaGe-initBPE**: 2,705 (light blue).
- **BPE ∩ SaGe-initBPE**: 1,279 (purple).
- **BPE ∩ PathPiece-initBPE ∩ SaGe-initBPE**: 21,250 (dark purple).
- **Unique Regions**:
- **BPE-only**: 6,273 (red).
- **PathPiece-initBPE-only**: 4,847 (green).
- **SaGe-initBPE-only**: 15,726 (blue).
### Detailed Analysis
- **BPE (Red)**:
- Total: 6,273 (unique) + 12,158 (BPE ∩ PathPiece) + 1,279 (BPE ∩ SaGe) + 21,250 (triple overlap) = **40,960**.
- **PathPiece-initBPE (Green)**:
- Total: 4,847 (unique) + 12,158 (BPE ∩ PathPiece) + 2,705 (PathPiece ∩ SaGe) + 21,250 (triple overlap) = **40,960**.
- **SaGe-initBPE (Blue)**:
- Total: 15,726 (unique) + 2,705 (PathPiece ∩ SaGe) + 1,279 (BPE ∩ SaGe) + 21,250 (triple overlap) = **40,960**.
- **Triple Overlap (Dark Purple)**: 21,250 (largest shared region).
- **Smallest Overlap**: BPE ∩ SaGe-initBPE (1,279).
### Key Observations
1. **Dominant Overlap**: The triple intersection (21,250) is the largest shared region, indicating significant commonality across all three datasets.
2. **SaGe-initBPE Dominance**: SaGe-initBPE has the largest unique region (15,726), suggesting it contains the most distinct elements.
3. **Minimal BPE-SaGe Overlap**: Only 1,279 elements are shared exclusively between BPE and SaGe-initBPE, highlighting limited direct interaction between these two.
4. **Symmetry**: All three datasets have identical total sizes (40,960), implying balanced representation despite differing overlaps.
### Interpretation
The diagram reveals that **SaGe-initBPE** contributes the most unique data, while the **triple overlap** (21,250) represents the core shared functionality or features among all three. The minimal BPE-SaGe overlap (1,279) suggests potential gaps in integration or compatibility between these two. The symmetry in total sizes implies the datasets were designed to be comparable, but their distinct overlaps highlight nuanced differences in scope or methodology. This could reflect trade-offs in efficiency, accuracy, or resource usage between the approaches.