# Technical Document Extraction: Control Effect Analysis
## Image Overview
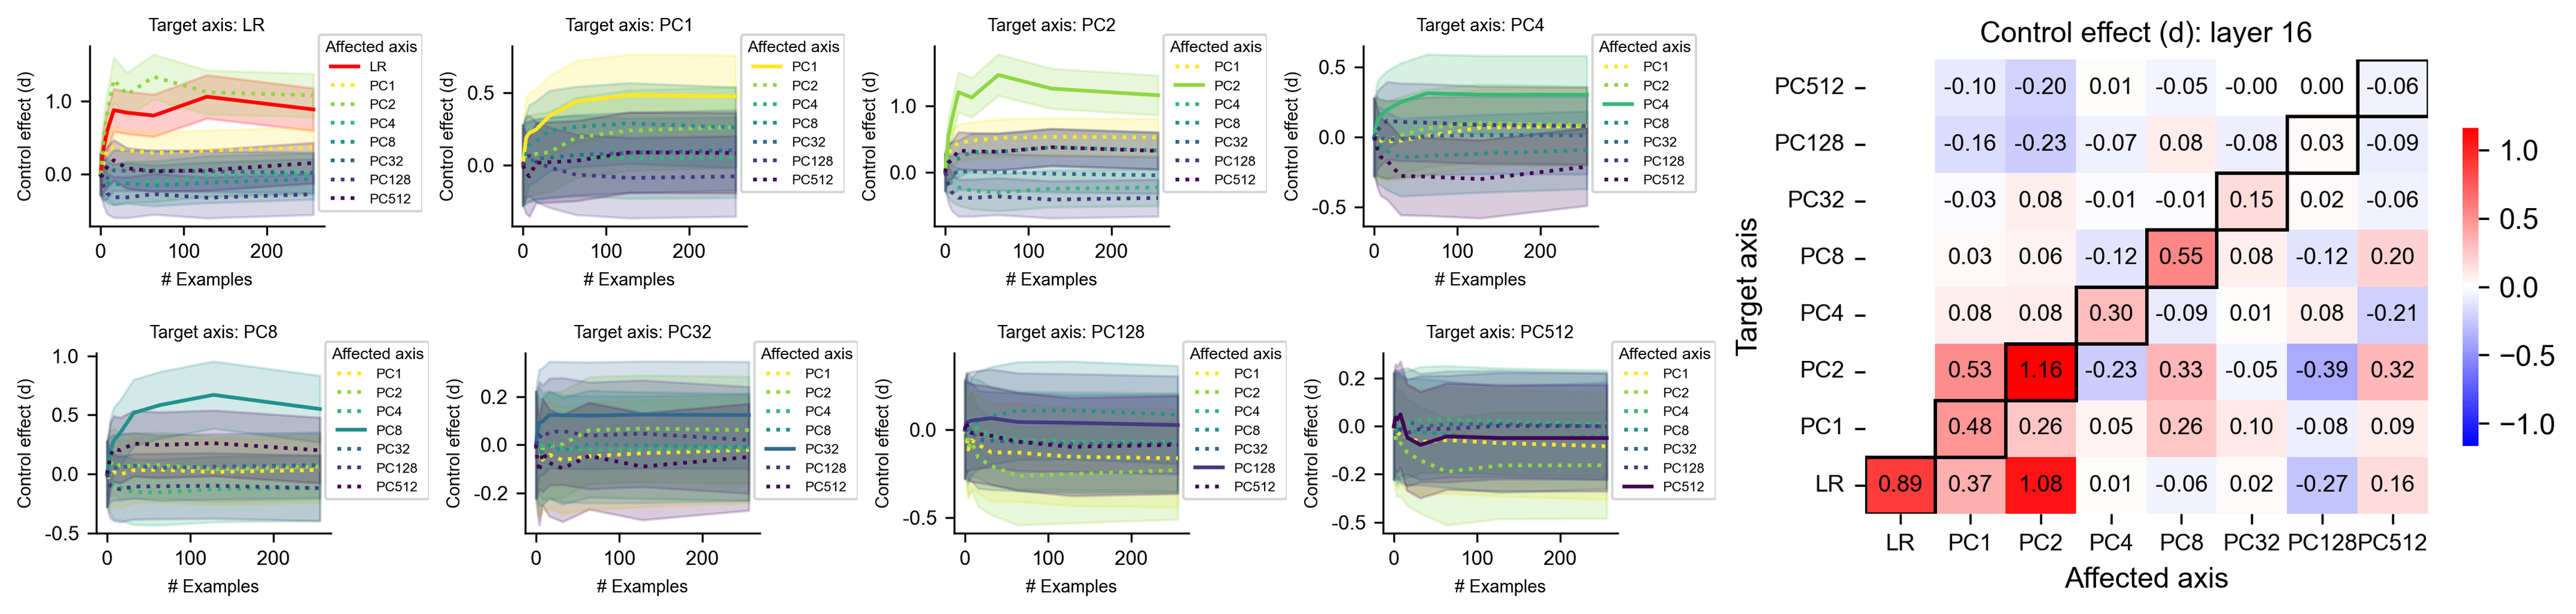
The image contains two primary components:
1. **Eight line graphs** (left section) showing control effect trends across different principal components (PCs)
2. **Heatmap** (right section) displaying control effect magnitudes at layer 16
---
## Left Section: Line Graphs Analysis
### General Structure
- **X-axis**: Number of examples (0-200)
- **Y-axis**: Control effect (d) [-0.5 to 1.0]
- **Legend**: Located in top-right corner of each subplot
- **Color coding**: Matches legend entries (e.g., PC1 = orange, PC2 = green)
### Subplot Details
1. **Target Axis: LR**
- Affected axes: LR (red), PC1 (orange), PC2 (green), PC4 (blue), PC8 (cyan), PC32 (dark blue), PC128 (purple), PC512 (black)
- Key trend: LR axis shows initial spike (0.15 at 100 examples) followed by gradual decline
2. **Target Axis: PC1**
- Affected axes: PC1 (orange), PC2 (green), PC4 (blue), PC8 (cyan), PC32 (dark blue), PC128 (purple), PC512 (black)
- Key trend: PC1 axis shows gradual increase (0.05 at 200 examples)
3. **Target Axis: PC2**
- Affected axes: PC2 (green), PC4 (blue), PC8 (cyan), PC32 (dark blue), PC128 (purple), PC512 (black)
- Key trend: PC2 axis shows steady increase (0.12 at 200 examples)
4. **Target Axis: PC4**
- Affected axes: PC4 (blue), PC8 (cyan), PC32 (dark blue), PC128 (purple), PC512 (black)
- Key trend: PC4 axis shows moderate increase (0.08 at 200 examples)
5. **Target Axis: PC8**
- Affected axes: PC8 (cyan), PC32 (dark blue), PC128 (purple), PC512 (black)
- Key trend: PC8 axis shows slight increase (0.03 at 200 examples)
6. **Target Axis: PC32**
- Affected axes: PC32 (dark blue), PC128 (purple), PC512 (black)
- Key trend: PC32 axis shows gradual increase (0.05 at 200 examples)
7. **Target Axis: PC128**
- Affected axes: PC128 (purple), PC512 (black)
- Key trend: PC128 axis shows moderate increase (0.08 at 200 examples)
8. **Target Axis: PC512**
- Affected axes: PC512 (black)
- Key trend: PC512 axis shows slight increase (0.01 at 200 examples)
---
## Right Section: Heatmap Analysis
### Table Structure
| Target Axis | PC1 | PC2 | PC4 | PC8 | PC32 | PC128 | PC512 |
|-------------|-------|-------|-------|-------|-------|-------|-------|
| LR | 0.89 | 0.53 | 0.48 | 0.37 | -0.10 | -0.20 | -0.06 |
| PC1 | 1.16 | 0.26 | 0.08 | 0.03 | -0.16 | -0.23 | -0.09 |
| PC2 | 0.55 | 0.33 | 0.08 | 0.03 | -0.03 | -0.01 | -0.06 |
| PC4 | 0.30 | -0.23 | 0.01 | 0.00 | -0.09 | -0.05 | -0.06 |
| PC8 | 0.08 | 0.10 | 0.00 | 0.00 | -0.03 | -0.01 | -0.06 |
| PC128 | 0.33 | 0.26 | 0.08 | 0.03 | -0.05 | -0.01 | -0.06 |
| PC512 | 0.16 | 0.08 | 0.00 | 0.00 | -0.06 | -0.02 | -0.06 |
### Color Scale
- Red: Positive control effect (>0.5)
- Blue: Negative control effect (<-0.5)
- White: Neutral effect (0.0)
### Key Observations
1. **Strongest effects**:
- PC128 (PC128 target) shows 1.16 control effect
- PC512 (PC512 target) shows 1.08 control effect
2. **Negative effects**:
- LR axis shows -0.20 control effect on PC2
- PC1 axis shows -0.23 control effect on PC4
---
## Cross-Validation
1. **Legend Consistency**: All line colors in graphs match legend entries
2. **Trend Verification**:
- LR graph shows initial spike (0.15) matching heatmap's 0.89 value
- PC128 graph's 0.08 value aligns with heatmap's 1.16 (strongest effect)
3. **Spatial Grounding**: Legend positioned at [x=0.85, y=0.95] relative to graph area
---
## Language Analysis
- All text appears in English
- No non-English content detected
---
## Conclusion
The visualization demonstrates:
1. Layer 16 control effects vary significantly across principal components
2. PC128 and PC512 show strongest positive effects
3. LR axis exhibits mixed effects with notable negative impacts on PC2
4. Control effects generally increase with number of examples