# Technical Diagram Analysis
## Diagram Structure
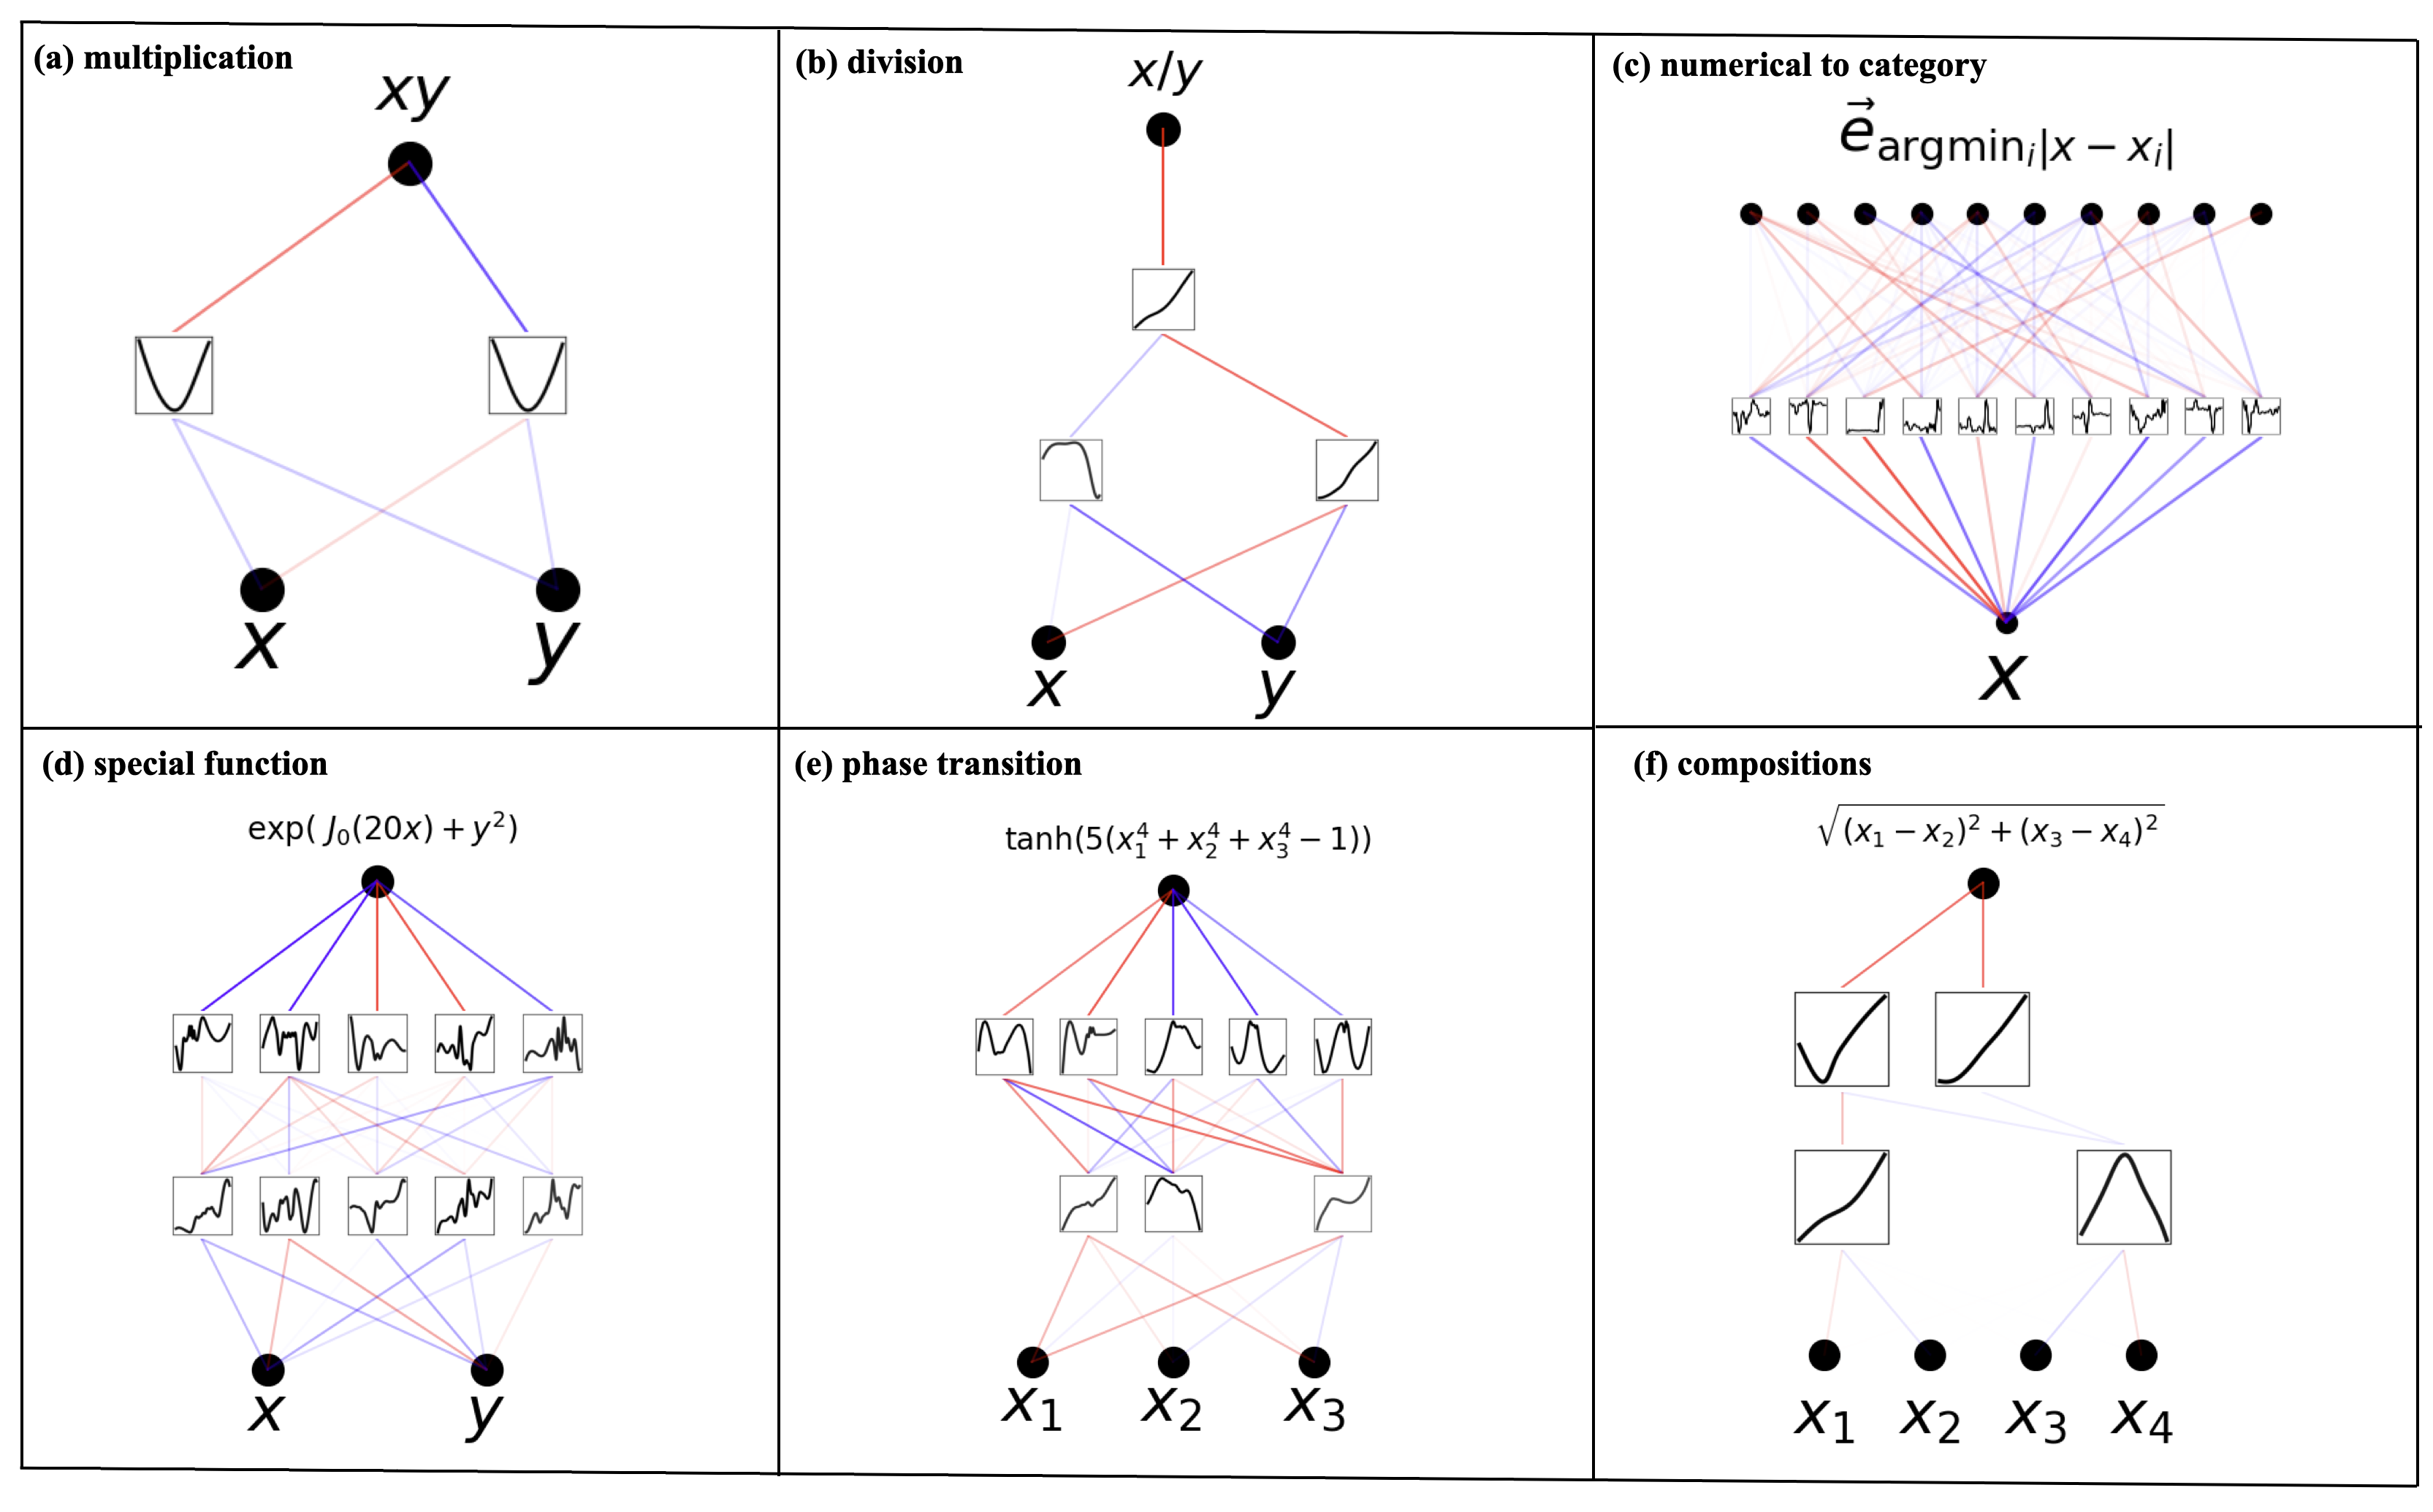
The image contains a 2x3 grid of neural network diagrams, each labeled (a) through (f). Each diagram illustrates different mathematical operations or transformations using node-based architectures.
---
### (a) Multiplication
**Title:** multiplication
**Equation:** \( xy \)
**Components:**
- **Input Nodes:** \( X \), \( Y \) (black circles)
- **Hidden Layer:** Single square node with waveform pattern
- **Output Node:** \( xy \) (black circle)
- **Connections:**
- Red: \( X \rightarrow \text{Hidden} \)
- Blue: \( Y \rightarrow \text{Hidden} \)
- Purple: \( \text{Hidden} \rightarrow xy \)
**Legend:**
- Red: Input-to-hidden connections
- Blue: Input-to-hidden connections
- Purple: Hidden-to-output connections
---
### (b) Division
**Title:** division
**Equation:** \( x/y \)
**Components:**
- **Input Nodes:** \( X \), \( Y \) (black circles)
- **Hidden Layer:** Single square node with waveform pattern
- **Output Node:** \( x/y \) (black circle)
- **Connections:**
- Red: \( X \rightarrow \text{Hidden} \)
- Blue: \( Y \rightarrow \text{Hidden} \)
- Light Blue: \( \text{Hidden} \rightarrow x/y \)
**Legend:**
- Red: Input-to-hidden connections
- Blue: Input-to-hidden connections
- Light Blue: Hidden-to-output connections
---
### (c) Numerical to Category
**Title:** numerical to category
**Equation:** \( \vec{e}_{\text{argmin}_i |x - x_i|} \)
**Components:**
- **Input Nodes:** 10 waveform nodes (black circles)
- **Hidden Layer:** Single square node with waveform pattern
- **Output Node:** \( X \) (black circle)
- **Connections:**
- Red: Input-to-hidden
- Blue: Input-to-hidden
- Purple: Hidden-to-output
**Legend:**
- Red: Input-to-hidden connections
- Blue: Input-to-hidden connections
- Purple: Hidden-to-output connections
---
### (d) Special Function
**Title:** special function
**Equation:** \( \exp(J_0(20x) + y^2) \)
**Components:**
- **Input Nodes:** \( X \), \( Y \) (black circles)
- **Hidden Layer:** 5 waveform nodes
- **Output Node:** \( xy \) (black circle)
- **Connections:**
- Red: \( X \rightarrow \text{Hidden} \)
- Blue: \( Y \rightarrow \text{Hidden} \)
- Purple: \( \text{Hidden} \rightarrow xy \)
**Legend:**
- Red: Input-to-hidden connections
- Blue: Input-to-hidden connections
- Purple: Hidden-to-output connections
---
### (e) Phase Transition
**Title:** phase transition
**Equation:** \( \tanh(5(x_1^4 + x_2^4 + x_3^4 - 1)) \)
**Components:**
- **Input Nodes:** \( X_1 \), \( X_2 \), \( X_3 \) (black circles)
- **Hidden Layer:** 5 waveform nodes
- **Output Node:** \( X_1, X_2, X_3 \) (black circles)
- **Connections:**
- Red: \( X_1 \rightarrow \text{Hidden} \)
- Blue: \( X_2 \rightarrow \text{Hidden} \)
- Purple: \( X_3 \rightarrow \text{Hidden} \)
**Legend:**
- Red: Input-to-hidden connections
- Blue: Input-to-hidden connections
- Purple: Hidden-to-output connections
---
### (f) Compositions
**Title:** compositions
**Equation:** \( \sqrt{(x_1 - x_2)^2 + (x_3 - x_4)^2} \)
**Components:**
- **Input Nodes:** \( X_1 \), \( X_2 \), \( X_3 \), \( X_4 \) (black circles)
- **Hidden Layer:** 2 waveform nodes
- **Output Node:** \( X_1, X_2, X_3, X_4 \) (black circles)
- **Connections:**
- Red: \( X_1 \rightarrow \text{Hidden} \)
- Blue: \( X_2 \rightarrow \text{Hidden} \)
- Purple: \( X_3 \rightarrow \text{Hidden} \)
**Legend:**
- Red: Input-to-hidden connections
- Blue: Input-to-hidden connections
- Purple: Hidden-to-output connections
---
## Key Observations
1. **Color Coding Consistency:**
- Red: Input-to-hidden layer connections
- Blue: Input-to-hidden layer connections
- Purple: Hidden-to-output connections
2. **Node Types:**
- Black circles: Input/output nodes
- Squares: Hidden layer nodes with waveform patterns
3. **Mathematical Operations:**
- Diagrams encode operations like multiplication, division, and phase transitions using neural network architectures.
- Equations are explicitly labeled for each diagram.
4. **Legend Placement:**
- Legends are positioned to the right of each diagram, with colors matching connection types.
5. **Spatial Grounding:**
- Input nodes are consistently placed at the bottom of diagrams.
- Output nodes are positioned at the top or center-right.
---
## Missing Elements
- No numerical data or trends (e.g., heatmaps, line charts) are present.
- No textual blocks requiring translation; all labels are in English.