## Line Chart: Jensen-Shannon Divergence
### Overview
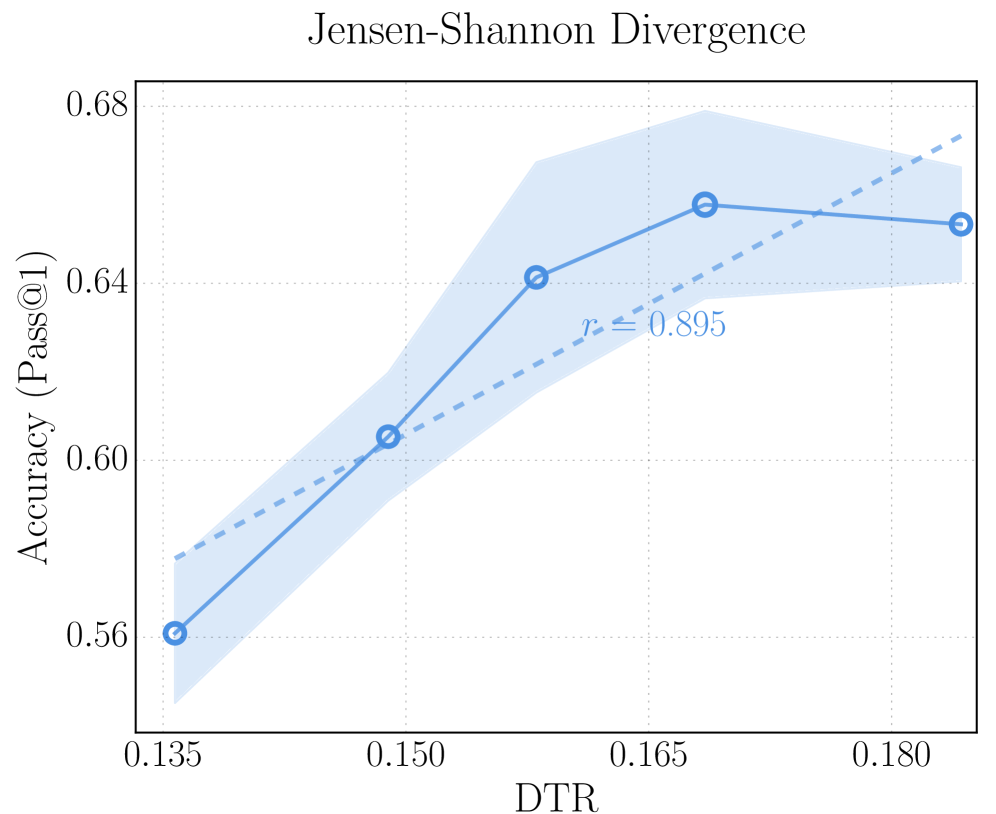
The image is a line chart titled "Jensen-Shannon Divergence". It plots the relationship between "DTR" on the x-axis and "Accuracy (Pass@1)" on the y-axis. The chart includes a solid blue line representing the data, a shaded blue area around the line indicating uncertainty, and a dashed blue line representing a linear trend.
### Components/Axes
* **Title:** Jensen-Shannon Divergence
* **X-axis:** DTR (Decomposition Tree Rank)
* Scale: 0.135 to 0.180
* Markers: 0.135, 0.150, 0.165, 0.180
* **Y-axis:** Accuracy (Pass@1)
* Scale: 0.56 to 0.68
* Markers: 0.56, 0.60, 0.64, 0.68
* **Data Series:**
* Solid Blue Line: Represents the accuracy at different DTR values.
* Shaded Blue Area: Indicates the uncertainty or variance around the accuracy values.
* Dashed Blue Line: Represents a linear trend line.
* **Correlation Coefficient:** r ≈ 0.895, located near the center of the chart.
### Detailed Analysis
* **Solid Blue Line (Accuracy):**
* At DTR = 0.135, Accuracy ≈ 0.56
* At DTR = 0.150, Accuracy ≈ 0.605
* At DTR = 0.165, Accuracy ≈ 0.66
* At DTR = 0.180, Accuracy ≈ 0.65
* Trend: The accuracy generally increases from DTR 0.135 to 0.165, then slightly decreases from 0.165 to 0.180.
* **Shaded Blue Area (Uncertainty):**
* The shaded area widens as DTR increases, suggesting greater uncertainty at higher DTR values.
* **Dashed Blue Line (Linear Trend):**
* The dashed line shows a positive linear trend, indicating a general increase in accuracy as DTR increases.
* The dashed line starts at approximately (0.135, 0.58) and ends at approximately (0.180, 0.67).
### Key Observations
* The accuracy increases significantly between DTR values of 0.135 and 0.165.
* The accuracy plateaus or slightly decreases after a DTR of 0.165.
* The uncertainty increases with higher DTR values.
* The correlation coefficient (r ≈ 0.895) indicates a strong positive correlation between DTR and accuracy.
### Interpretation
The chart suggests that increasing the Decomposition Tree Rank (DTR) initially leads to a significant improvement in accuracy (Pass@1). However, after a certain point (around DTR = 0.165), the accuracy plateaus, and further increases in DTR do not result in substantial gains. The increasing uncertainty at higher DTR values suggests that the model's performance becomes less predictable as DTR increases. The strong positive correlation coefficient supports the overall trend of increasing accuracy with increasing DTR, but the plateauing effect indicates diminishing returns.