\n
## Line Chart: Jensen-Shannon Divergence
### Overview
This image presents a line chart illustrating the relationship between DTR (likely a measure of diversity or retrieval rate) and Accuracy (Pass@1), with confidence intervals represented by a shaded region. Two lines are plotted, representing different conditions or models. A correlation coefficient is also displayed.
### Components/Axes
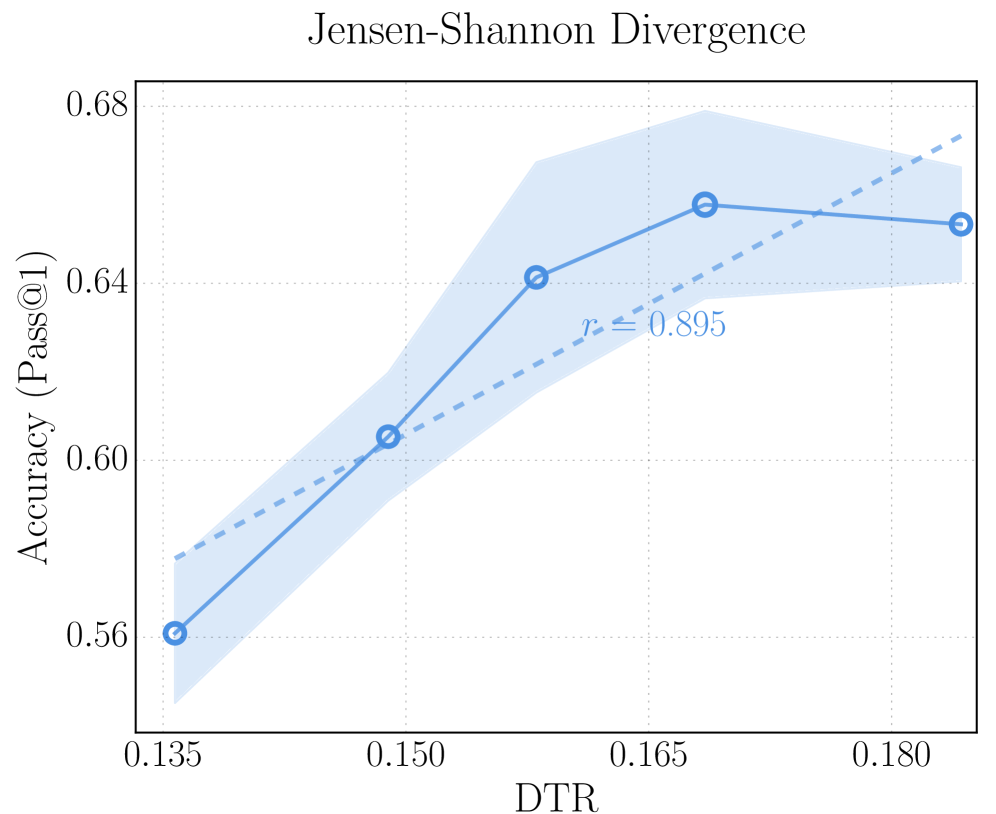
* **Title:** Jensen-Shannon Divergence
* **X-axis:** DTR (ranging approximately from 0.135 to 0.180)
* **Y-axis:** Accuracy (Pass@1) (ranging approximately from 0.56 to 0.68)
* **Line 1 (Solid Line):** Represents a trend with circular markers.
* **Line 2 (Dashed Line):** Represents a trend with circular markers.
* **Shaded Region:** Represents the confidence interval around the lines, colored in light blue.
* **Text Annotation:** "r = ≤ 0.895" – indicating a correlation coefficient.
### Detailed Analysis
**Line 1 (Solid Line):**
The solid line exhibits an upward trend initially, then plateaus.
* At DTR ≈ 0.135, Accuracy ≈ 0.56.
* At DTR ≈ 0.150, Accuracy ≈ 0.60.
* At DTR ≈ 0.165, Accuracy ≈ 0.64.
* At DTR ≈ 0.180, Accuracy ≈ 0.65.
**Line 2 (Dashed Line):**
The dashed line shows a more gradual upward trend throughout the range.
* At DTR ≈ 0.135, Accuracy ≈ 0.56.
* At DTR ≈ 0.150, Accuracy ≈ 0.59.
* At DTR ≈ 0.165, Accuracy ≈ 0.63.
* At DTR ≈ 0.180, Accuracy ≈ 0.67.
The confidence interval (shaded region) is widest around DTR ≈ 0.165 and narrows towards the extremes of the DTR range.
The correlation coefficient is stated as "r = ≤ 0.895", indicating a strong positive correlation, but with some uncertainty. The annotation is positioned near the dashed line, suggesting it may relate to that line's correlation.
### Key Observations
* Both lines demonstrate a positive correlation between DTR and Accuracy. Higher DTR values generally correspond to higher Accuracy values.
* The dashed line consistently shows lower accuracy values than the solid line across the entire DTR range.
* The confidence intervals suggest greater uncertainty in the relationship around DTR ≈ 0.165.
* The solid line shows a diminishing return in accuracy as DTR increases beyond approximately 0.165.
### Interpretation
The chart suggests that increasing DTR generally improves Accuracy (Pass@1). The difference between the two lines indicates that the method represented by the solid line performs better than the method represented by the dashed line across all DTR values. The confidence intervals provide a measure of the variability in the data, and the correlation coefficient confirms a strong positive relationship between the two variables. The plateauing of the solid line suggests that there may be a point of diminishing returns, where further increases in DTR do not lead to significant improvements in Accuracy. The Jensen-Shannon Divergence title suggests that this chart is analyzing the divergence between two probability distributions, and how that divergence impacts the accuracy of a retrieval or classification system. The DTR likely represents a measure of the diversity of the retrieved results, and the accuracy is measuring the probability that the top result is correct.