\n
## Line Chart: Jensen-Shannon Divergence vs. Accuracy (Pass@1)
### Overview
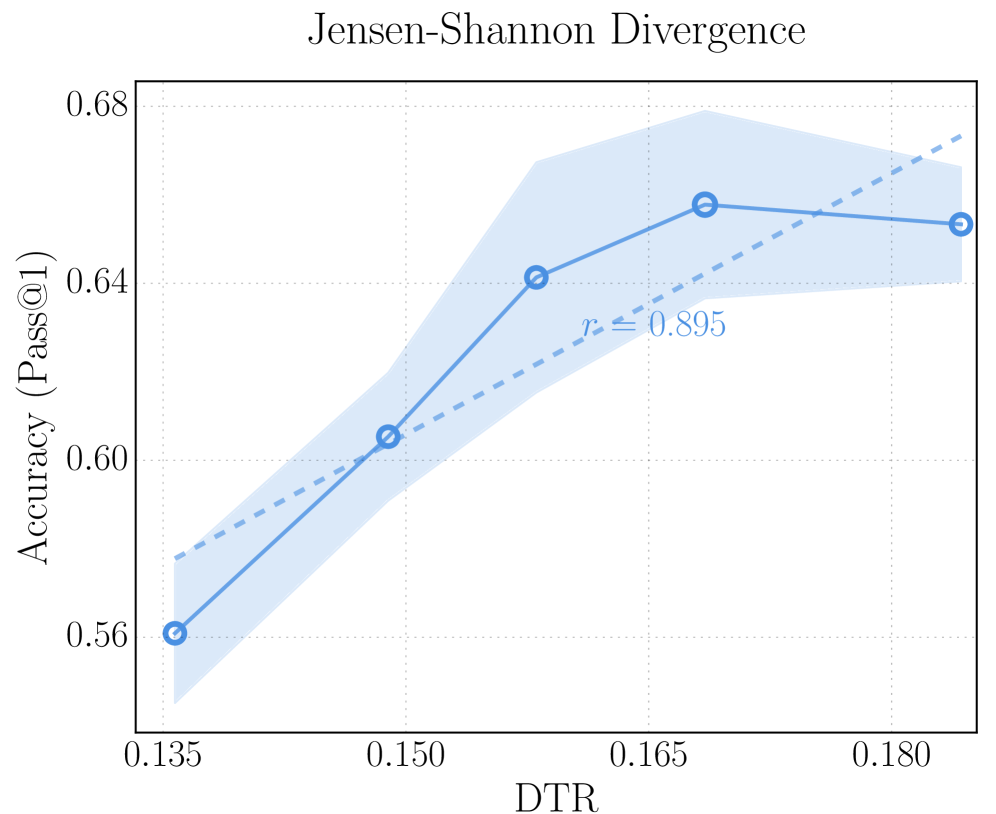
The image is a line chart titled "Jensen-Shannon Divergence." It plots a metric called "Accuracy (Pass@1)" against "DTR" (likely an acronym for a specific divergence or ratio metric). The chart shows a positive correlation between the two variables, with a primary data series (solid line with markers) and a linear trend line (dashed line). A shaded region around the primary line indicates a confidence interval or range of uncertainty.
### Components/Axes
* **Title:** "Jensen-Shannon Divergence" (centered at the top).
* **Y-Axis:**
* **Label:** "Accuracy (Pass@1)" (rotated vertically on the left).
* **Scale:** Linear, ranging from approximately 0.56 to 0.68.
* **Major Ticks:** 0.56, 0.60, 0.64, 0.68.
* **X-Axis:**
* **Label:** "DTR" (centered at the bottom).
* **Scale:** Linear, ranging from approximately 0.135 to 0.180.
* **Major Ticks:** 0.135, 0.150, 0.165, 0.180.
* **Data Series:**
1. **Primary Series (Solid Blue Line with Circle Markers):** Represents the measured relationship between DTR and Accuracy. It is accompanied by a light blue shaded region representing the confidence interval or standard deviation.
2. **Trend Line (Dashed Blue Line):** Represents a linear fit to the primary data series.
* **Annotation:** The text "r = 0.895" is placed in the middle-right area of the plot, near the dashed trend line, indicating the Pearson correlation coefficient.
### Detailed Analysis
**Primary Data Series (Solid Line):**
The line connects five distinct data points (blue circles). The trend is generally upward but shows signs of plateauing at higher DTR values.
* **Point 1 (Leftmost):** DTR ≈ 0.135, Accuracy ≈ 0.56.
* **Point 2:** DTR ≈ 0.150, Accuracy ≈ 0.605.
* **Point 3:** DTR ≈ 0.160, Accuracy ≈ 0.64.
* **Point 4:** DTR ≈ 0.170, Accuracy ≈ 0.655.
* **Point 5 (Rightmost):** DTR ≈ 0.185, Accuracy ≈ 0.65.
**Trend Line (Dashed Line):**
This line shows a steady, positive linear slope from the lower-left to the upper-right of the chart. It starts near (DTR=0.135, Accuracy≈0.575) and ends near (DTR=0.185, Accuracy≈0.675).
**Confidence Interval (Shaded Region):**
The shaded blue area represents uncertainty. It is narrowest at the first data point (DTR=0.135), widens significantly in the middle range (DTR=0.150 to 0.170), and narrows slightly again at the final point. This suggests greater variability or less certainty in the measurements for mid-range DTR values.
### Key Observations
1. **Strong Positive Correlation:** The annotation "r = 0.895" confirms a very strong positive linear relationship between DTR and Accuracy (Pass@1).
2. **Diminishing Returns:** While the trend line is linear, the primary data series shows a steep increase in accuracy from DTR=0.135 to 0.160, followed by a much flatter slope (a plateau) from DTR=0.160 to 0.185. This suggests that increases in DTR yield progressively smaller gains in accuracy beyond a certain point.
3. **Variable Uncertainty:** The confidence interval is not uniform. The model's predictions (or the measurement's reliability) appear most certain at the lowest DTR value and least certain in the middle of the observed range.
### Interpretation
The chart demonstrates that the Jensen-Shannon Divergence (as quantified by the DTR metric) is a strong predictor of model performance, specifically "Pass@1" accuracy. A higher DTR value is associated with higher accuracy.
The key insight is the **non-linear relationship** hidden within the strong linear correlation. The primary data suggests a saturation effect: initial improvements in DTR lead to dramatic accuracy gains, but these gains level off. This could imply that after achieving a certain level of distributional similarity (high DTR), further refinement provides minimal benefit to this specific accuracy metric. The widening confidence interval in the mid-range might indicate a transitional phase where model behavior is less stable or more sensitive to other factors.
For a technical document, this chart argues that optimizing for the Jensen-Shannon Divergence (or the underlying DTR measure) is a valid strategy for improving Pass@1 accuracy, but with the caveat that the relationship is subject to diminishing returns. The high correlation coefficient (0.895) makes it a reliable, but not perfect, indicator.