## Line Chart: Jensen-Shannon Divergence
### Overview
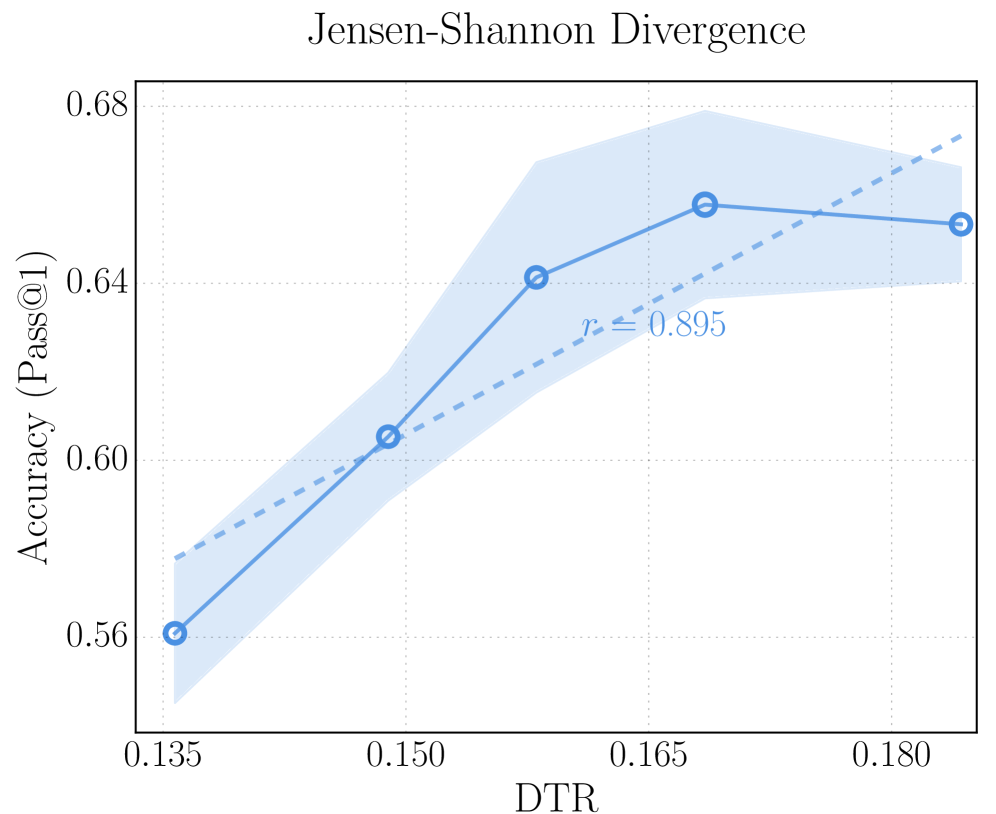
The chart illustrates the relationship between Jensen-Shannon Divergence (DTR) and accuracy (Pass@1) across four data points. A blue line connects the points, with a shaded confidence interval and a dashed trend line labeled with a correlation coefficient (r = 0.895).
### Components/Axes
- **X-axis (DTR)**: Ranges from 0.135 to 0.180 in increments of 0.015.
- **Y-axis (Accuracy (Pass@1))**: Ranges from 0.56 to 0.68 in increments of 0.02.
- **Legend**: No explicit legend, but the blue line and shaded area represent the primary data series. The dashed line represents the trend line.
- **Data Points**: Four blue circles marked at specific DTR values.
### Detailed Analysis
- **Data Points**:
- (0.135, 0.56)
- (0.150, 0.60)
- (0.165, 0.65)
- (0.180, 0.64)
- **Trend Line**: A dashed line with a slope of r = 0.895, indicating a strong positive correlation between DTR and accuracy.
- **Confidence Interval**: A shaded blue area surrounds the blue line, widening as DTR increases, suggesting increasing uncertainty in accuracy estimates.
### Key Observations
1. **Positive Correlation**: Accuracy increases with DTR, as shown by the upward slope of the blue line and the high r-value (0.895).
2. **Confidence Interval Expansion**: The shaded area widens from DTR = 0.135 to 0.180, indicating greater variability in accuracy at higher DTR values.
3. **Slight Decline at High DTR**: The final data point (0.180, 0.64) shows a minor decrease in accuracy compared to the peak at DTR = 0.165 (0.65).
### Interpretation
The data suggests that higher Jensen-Shannon Divergence (DTR) values are associated with improved accuracy (Pass@1), with a strong linear relationship (r = 0.895). However, the widening confidence interval implies that the relationship becomes less predictable at higher DTR values. The slight decline in accuracy at DTR = 0.180 may indicate a plateau or diminishing returns, warranting further investigation into the factors influencing this trend. The chart highlights the trade-off between DTR and accuracy, emphasizing the need for balanced optimization in applications relying on this metric.