## Line Chart: Attention Key Query Score (h/a = 64)
### Overview
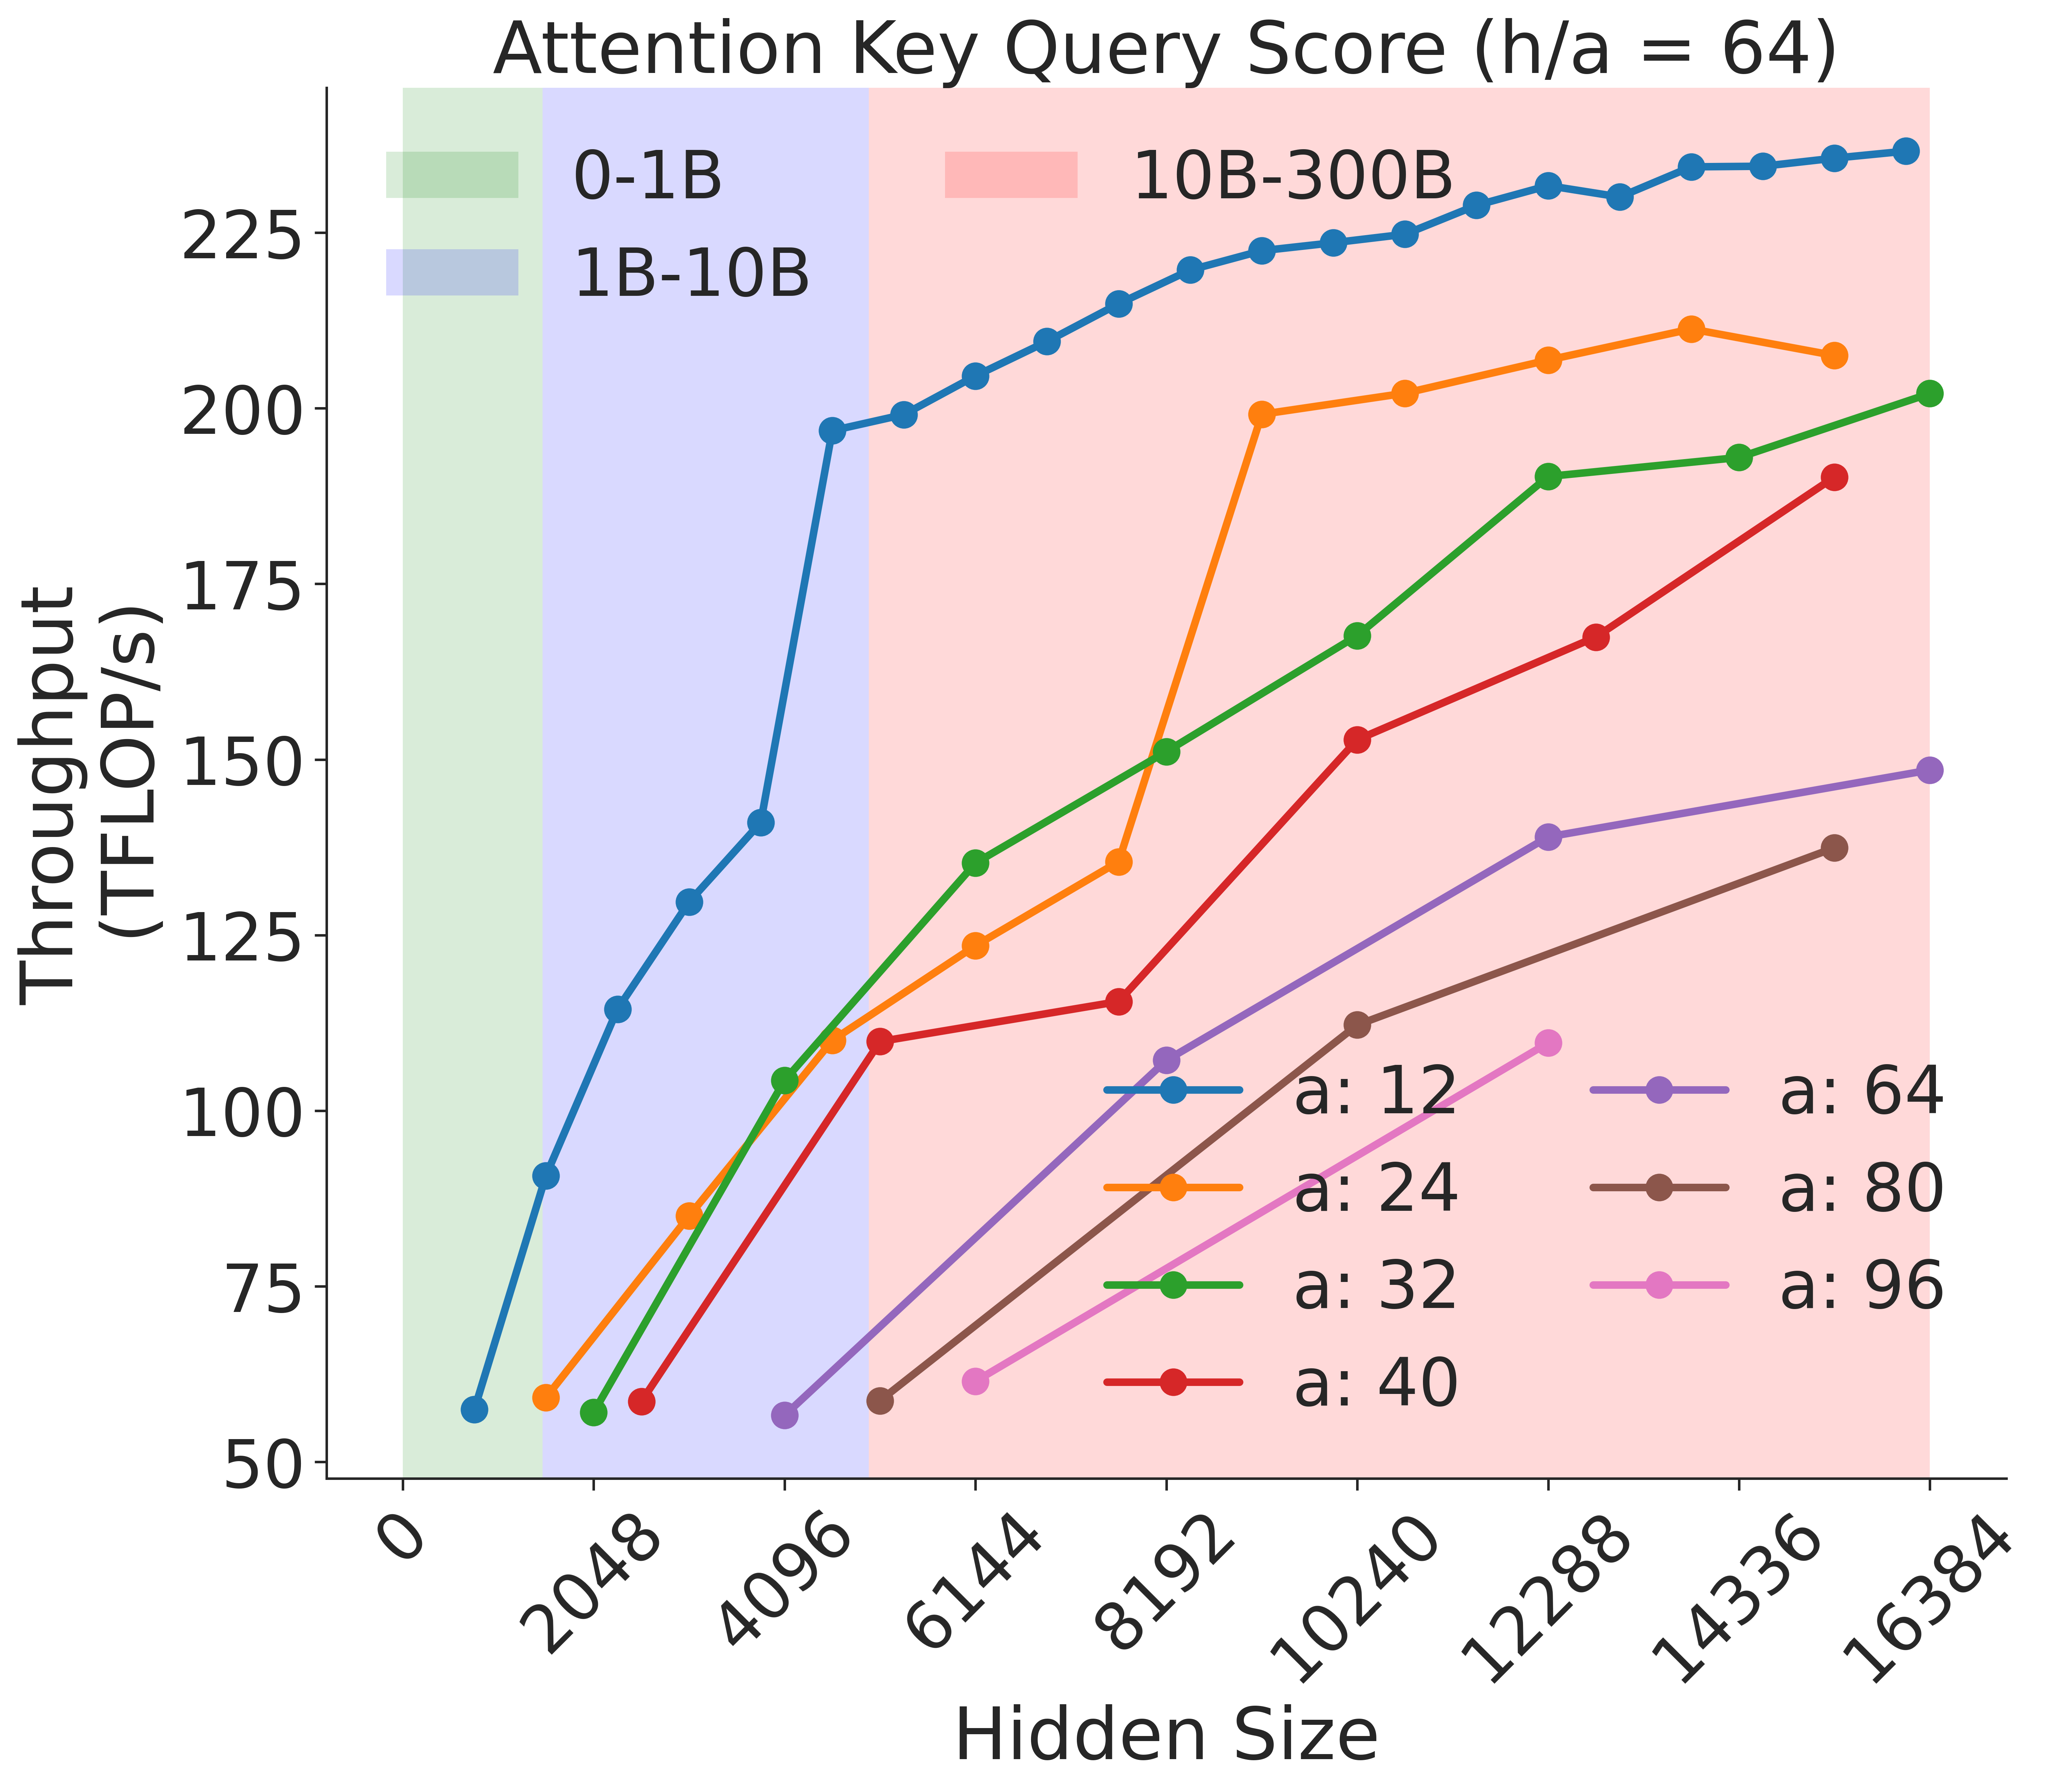
This image is a multi-series line chart illustrating the relationship between "Hidden Size" (x-axis) and "Throughput (TFLOP/s)" (y-axis) for various attention head configurations, denoted by the variable 'a'. The chart is divided into three vertical background regions representing different model parameter scales: 0-1B (green), 1B-10B (blue), and 10B-300B (pink).
### Components/Axes
* **Title:** "Attention Key Query Score (h/a = 64)" (Top center).
* **Y-Axis:** "Throughput (TFLOP/s)". Scale ranges from 50 to 225, with major ticks every 25 units.
* **X-Axis:** "Hidden Size". Scale ranges from 0 to 16384, with major ticks at 0, 2048, 4096, 6144, 8192, 10240, 12288, 14336, 16384.
* **Background Regions:**
* **Green (Left):** 0-1B parameters.
* **Blue (Center):** 1B-10B parameters.
* **Pink (Right):** 10B-300B parameters.
* **Legend (Bottom-Right):**
* **Left Column:**
* `a: 12` (Blue line)
* `a: 24` (Orange line)
* `a: 32` (Green line)
* `a: 40` (Red line)
* **Right Column:**
* `a: 64` (Purple line)
* `a: 80` (Brown line)
* `a: 96` (Pink line)
### Detailed Analysis
The chart displays seven distinct data series, each representing a specific 'a' value. All series exhibit a positive correlation: as Hidden Size increases, Throughput (TFLOP/s) increases.
**Trend Verification & Data Points:**
1. **a: 12 (Blue Line):**
* **Trend:** Steepest upward slope. Starts at ~58 TFLOP/s (Hidden Size ~1024) and climbs steadily to ~235 TFLOP/s (Hidden Size 16384).
* **Note:** Shows a significant inflection point/jump in throughput when transitioning from the Blue (1B-10B) to the Pink (10B-300B) region (around Hidden Size 6144).
2. **a: 24 (Orange Line):**
* **Trend:** Strong upward slope. Starts at ~60 TFLOP/s (Hidden Size ~1536) and reaches ~208 TFLOP/s (Hidden Size 14336).
3. **a: 32 (Green Line):**
* **Trend:** Consistent upward slope. Starts at ~58 TFLOP/s (Hidden Size ~1536) and reaches ~202 TFLOP/s (Hidden Size 16384).
4. **a: 40 (Red Line):**
* **Trend:** Moderate upward slope. Starts at ~58 TFLOP/s (Hidden Size ~2048) and reaches ~190 TFLOP/s (Hidden Size 14336).
5. **a: 64 (Purple Line):**
* **Trend:** Starts later than others (Hidden Size ~4096) at ~58 TFLOP/s. Climbs to ~148 TFLOP/s (Hidden Size 16384).
6. **a: 80 (Brown Line):**
* **Trend:** Starts at ~58 TFLOP/s (Hidden Size ~4096). Climbs to ~138 TFLOP/s (Hidden Size 12288).
7. **a: 96 (Pink Line):**
* **Trend:** Shallowest slope. Starts at ~62 TFLOP/s (Hidden Size ~6144) and reaches ~110 TFLOP/s (Hidden Size 12288).
### Key Observations
* **Inverse Efficiency:** There is a clear inverse relationship between the 'a' value and throughput. Lower 'a' values (12, 24) consistently achieve higher TFLOP/s than higher 'a' values (64, 80, 96) at any given Hidden Size.
* **Scaling Efficiency:** Throughput generally scales well with Hidden Size across all configurations.
* **Region Transitions:** The transition from the Blue (1B-10B) to the Pink (10B-300B) region (around Hidden Size 6144) appears to be a critical performance threshold, particularly for the lower 'a' value series, which show steeper gains after this point.
* **Data Sparsity:** Higher 'a' values (64, 80, 96) have fewer data points plotted, suggesting these configurations may not be tested or applicable at smaller Hidden Sizes.
### Interpretation
This chart demonstrates the performance trade-offs in attention mechanism design for Large Language Models (LLMs). The variable 'a' likely represents the number of attention heads.
* **Performance Implications:** The data suggests that for a fixed "h/a = 64" (hidden size per head), using fewer attention heads (lower 'a') results in significantly higher computational throughput. This is likely due to reduced overhead in managing attention head parallelism or more efficient memory access patterns on the underlying hardware (e.g., GPU/TPU).
* **Scaling:** The upward trend across all lines confirms that increasing the Hidden Size is an effective way to increase TFLOP/s, likely by saturating the compute units more effectively as the matrix operations become larger.
* **Strategic Design:** The chart serves as a guide for model architects: if maximizing throughput is the primary goal, lower 'a' values are preferable. However, the choice of 'a' is usually constrained by model architecture requirements (e.g., model capacity, training stability), so this chart highlights the "cost" in throughput for choosing higher head counts.