# Technical Document Extraction: MoSe2 Electron Flow Visualization
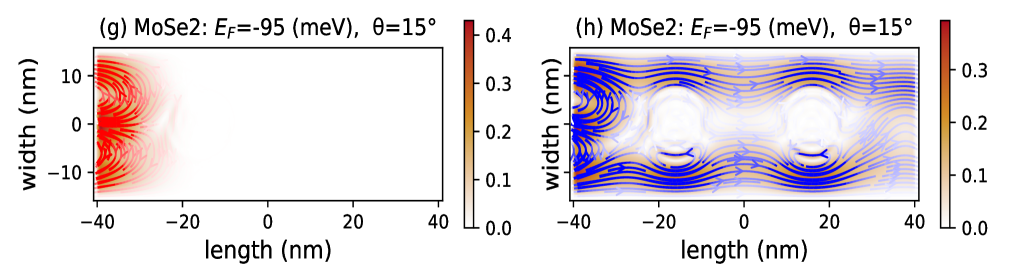
## Panel (g): MoSe2 Electron Flow at E_F = -95 meV, θ = 15°
### Labels and Axis Markers
- **X-axis**: `length (nm)` with markers: `-40, -20, 0, 20, 40`
- **Y-axis**: `width (nm)` with markers: `-10, 0, 10`
- **Color Scale**: `0.0` (white) to `0.4` (red), labeled on the right
### Key Observations
- **Streamline Pattern**:
- Red streamlines concentrated on the **left edge** (length ≈ -40 nm to -20 nm).
- Streamlines exhibit a **radial outward flow** from the left boundary.
- Intensity decreases exponentially toward the center (length > 0 nm), transitioning to white.
- **Color Gradient**:
- Highest values (red) localized near the left edge.
- Smooth gradient to white in the central and right regions.
---
## Panel (h): MoSe2 Electron Flow at E_F = -95 meV, θ = 15°
### Labels and Axis Markers
- **X-axis**: `length (nm)` with markers: `-40, -20, 0, 20, 40`
- **Y-axis**: `width (nm)` with markers: `-10, 0, 10`
- **Color Scale**: `0.0` (white) to `0.3` (blue), labeled on the right
### Key Observations
- **Streamline Pattern**:
- Blue streamlines form **closed loops** around two bright regions near the center (length ≈ 0 nm).
- Loops suggest **circular or vortex-like flow** around these regions.
- Additional flow lines extend radially outward from the loops toward the edges.
- **Color Gradient**:
- Bright white regions (high intensity) at the center, surrounded by blue streamlines.
- Intensity diminishes toward the edges, transitioning to white.
---
## Cross-Reference: Color Scale and Streamline Correlation
- **Panel (g)**: Red streamlines align with the highest intensity values (0.4) on the color scale.
- **Panel (h)**: Blue streamlines correspond to moderate intensity values (0.3) on the color scale, with white regions indicating peak intensities.
## Summary
Both panels visualize electron flow in MoSe2 under identical Fermi energy (E_F = -95 meV) and angle (θ = 15°). Panel (g) emphasizes **edge-driven flow**, while panel (h) highlights **central vortex dynamics**. Color scales quantify intensity, with streamlines mapping directional flow patterns.