\n
## Diagram: Representation of a Computational Region
### Overview
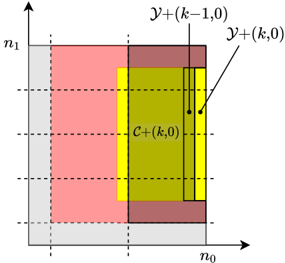
The image depicts a rectangular region divided into several sub-regions, likely representing a computational domain or a data structure. The region is defined by axes labeled *n₀* and *n₁*. Within this region, there are areas colored in pink, yellow, and green, with dotted lines indicating boundaries and labels pointing to specific points or areas. The diagram appears to illustrate a partitioning or decomposition of a larger space.
### Components/Axes
* **Axes:**
* *n₀* (Horizontal axis)
* *n₁* (Vertical axis)
* **Regions:**
* Pink region: Occupies the left side and bottom of the overall rectangle.
* Yellow region: Located in the center, partially overlapping with the green region.
* Green region: Occupies the central area, partially overlapping with the yellow region.
* **Labels:**
* *y+(k,0)*: Points to a location on the right edge of the green region.
* *y+(k-1,0)*: Points to a location on the right edge of the green region, slightly below *y+(k,0)*.
* *c+(k,0)*: Located in the center of the green region.
* **Dotted Lines:** Vertical dotted lines divide the region into sections.
### Detailed Analysis or Content Details
The diagram shows a rectangular area defined by the axes *n₀* and *n₁*. The pink region occupies the space to the left and below the central regions. The yellow and green regions are positioned centrally, with the yellow region appearing to be a subset of the green region. The labels indicate specific points within the green region.
* *y+(k,0)* and *y+(k-1,0)* are positioned vertically adjacent to each other on the right edge of the green region. The label *y+(k,0)* is slightly above *y+(k-1,0)*.
* *c+(k,0)* is located in the center of the green region.
* The dotted lines suggest a partitioning of the space, potentially representing boundaries between different computational elements or data blocks.
There are no numerical values provided in the image. The labels use the variable *k*, suggesting a parameter or index.
### Key Observations
The diagram illustrates a hierarchical or nested structure. The green region contains the yellow region, and both are situated within the larger rectangular area defined by *n₀* and *n₁*. The labels *y+(k,0)* and *y+(k-1,0)* suggest a sequence or iteration, potentially related to a time step or a computational loop.
### Interpretation
This diagram likely represents a computational domain or a data structure used in a numerical method or algorithm. The different colored regions could represent different states, data types, or computational tasks. The labels *y+(k,0)* and *y+(k-1,0)* suggest a time-stepping or iterative process, where *k* represents the current iteration. *c+(k,0)* could represent a central point or value within the current iteration. The dotted lines indicate boundaries between different computational elements or data blocks.
The diagram is abstract and does not provide specific numerical data. It serves as a visual representation of a conceptual framework or a computational process. Without additional context, it is difficult to determine the exact meaning of the diagram. It could be related to finite element analysis, computational fluid dynamics, or other numerical simulations. The use of "+" in the labels suggests a positive or increasing value. The diagram is likely part of a larger technical document explaining a specific algorithm or method.