## Diagram: 2D Grid Representation of Mathematical Sets
### Overview
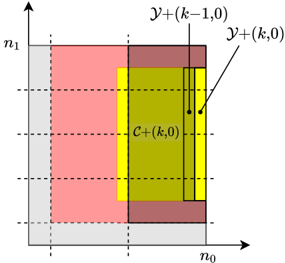
The image is a technical diagram illustrating a two-dimensional coordinate system with axes labeled `n₀` (horizontal) and `n₁` (vertical). It depicts several overlapping rectangular regions, each filled with a distinct color and labeled with mathematical notation. The diagram appears to represent sets, intervals, or computational domains, likely from a field such as discrete mathematics, computer science, or signal processing.
### Components/Axes
* **Axes:**
* **Horizontal Axis (X-axis):** Labeled `n₀` at the bottom right.
* **Vertical Axis (Y-axis):** Labeled `n₁` at the top left.
* Both axes have dashed grid lines extending into the plot area, creating a grid structure.
* **Labeled Regions (from left to right, with overlaps):**
1. **Gray Region:** A large rectangle occupying the left portion of the grid. It is unlabeled.
2. **Pink Region:** A rectangle to the right of the gray area. It is unlabeled.
3. **Yellow Region:** A rectangle that overlaps the right side of the pink region and extends further right. It is labeled `C+(k,0)` in its center.
4. **Brown Region:** A rectangle that overlaps the right side of the yellow region. It is labeled `Y+(k,0)` near its top-right corner.
5. **Inner Yellow Strip:** A narrow vertical yellow strip within the brown region, on its left side. It is labeled `Y+(k-1,0)` near its top.
* **Spatial Grounding:**
* The `C+(k,0)` label is centered within the main yellow rectangle.
* The `Y+(k,0)` label is positioned in the upper-right quadrant of the brown rectangle.
* The `Y+(k-1,0)` label is positioned in the upper part of the narrow yellow strip, which is itself located in the left portion of the brown rectangle.
### Detailed Analysis
* **Region Relationships and Overlaps:**
* The gray region forms the leftmost base layer.
* The pink region is adjacent to the gray region, sharing a vertical boundary.
* The yellow `C+(k,0)` region overlaps the right portion of the pink region. The area of overlap is a darker, olive-green color.
* The brown `Y+(k,0)` region overlaps the right portion of the yellow `C+(k,0)` region. The area of overlap is a darker, brownish-yellow color.
* The narrow yellow strip labeled `Y+(k-1,0)` is entirely contained within the brown `Y+(k,0)` region, along its left edge.
* **Grid Structure:** The dashed grid lines suggest the regions are defined over discrete integer coordinates on the `n₀` and `n₁` axes. The boundaries of the colored rectangles align with these grid lines.
### Key Observations
1. **Nested/Set Relationship:** The diagram visually suggests a potential subset or containment relationship. The region `Y+(k-1,0)` is entirely within `Y+(k,0)`, which in turn overlaps with `C+(k,0)`.
2. **Parameter `k`:** The labels use a parameter `k`. The notation `Y+(k,0)` and `Y+(k-1,0)` implies a sequence or progression where `k` is an index. The region for `k-1` is a subset of the region for `k`.
3. **Color Coding:** Each primary set (`C+`, `Y+`) is assigned a distinct color (yellow, brown). Overlap areas are shown with blended colors, clearly indicating intersection.
4. **Asymmetry:** The diagram is not symmetric. The progression and labeling are focused on the right side of the `n₀` axis.
### Interpretation
This diagram is a visual proof or explanatory tool for a mathematical concept involving sets in a 2D discrete space. It likely illustrates the following:
* **Set Definitions:** The colored rectangles define specific sets of coordinate pairs `(n₀, n₁)`. For example, `C+(k,0)` might represent all points where `n₀` is greater than some function of `k` and `n₁` is within a certain range.
* **Progression or Induction:** The inclusion of `Y+(k-1,0)` within `Y+(k,0)` strongly suggests an inductive step or a recursive definition. It shows how a set for a parameter `k` contains the set for the previous parameter `k-1`.
* **Intersection and Union:** The overlapping regions (`C+(k,0)` ∩ `Y+(k,0)`) are explicitly shown, which is crucial for understanding operations between these sets or for proving properties about their intersection.
* **Purpose:** The diagram serves to make abstract set relationships concrete and spatial. It allows a reader to quickly grasp containment, overlap, and the effect of the parameter `k` on the size and position of the sets `Y+` and `C+`. This is common in proofs involving induction, algorithm analysis (e.g., dynamic programming tables), or the study of discrete structures.
**Language Note:** The text in the image consists of mathematical notation using the Latin alphabet and standard symbols (`+`, `(`, `)`). No other language is present.