## Diagram: Layered State Progression with Offset Components
### Overview
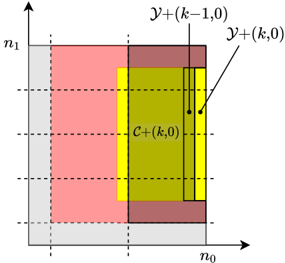
The diagram illustrates a layered progression of three components (C+(k,0), Y+(k-1,0), Y+(k,0)) across two axes (n₀ and n₁). The components are color-coded and spatially offset, suggesting a temporal or hierarchical relationship. The yellow block (C+(k,0)) is visually shifted rightward relative to the red (Y+(k-1,0)) and purple (Y+(k,0)) blocks, implying a dynamic interaction or dependency.
### Components/Axes
- **Axes**:
- **n₁ (Vertical)**: Labeled on the left axis, with grid lines indicating discrete levels.
- **n₀ (Horizontal)**: Labeled on the bottom axis, with grid lines marking intervals.
- **Legend**:
- **C+(k,0)**: Yellow block, positioned centrally but offset rightward.
- **Y+(k-1,0)**: Red block, leftmost and aligned with n₀.
- **Y+(k,0)**: Purple block, rightmost and aligned with n₀.
- **Key Elements**:
- Dashed grid lines partition the space into discrete regions.
- Arrows labeled "Y+(k-1,0)" and "Y+(k,0)" point to the red and purple blocks, respectively.
### Detailed Analysis
- **Color-Legend Alignment**:
- Red (Y+(k-1,0)): Leftmost block, fully aligned with n₀.
- Yellow (C+(k,0)): Centered but offset rightward by ~1 grid unit along n₀.
- Purple (Y+(k,0)): Rightmost block, aligned with n₀.
- **Spatial Relationships**:
- The yellow block (C+(k,0)) overlaps partially with the red and purple blocks vertically but is shifted rightward, suggesting a lag or lead in its progression.
- The red and purple blocks are vertically stacked but horizontally distinct, indicating separate states or phases.
### Key Observations
1. **Offset Yellow Block**: The rightward shift of C+(k,0) implies a temporal or causal delay relative to Y+(k-1,0) and Y+(k,0).
2. **Sequential Labeling**: The labels Y+(k-1,0) and Y+(k,0) suggest a progression indexed by "k," with C+(k,0) acting as an intermediary or transitional state.
3. **Grid Structure**: The dashed grid enforces discrete boundaries, emphasizing modular or stepwise interactions.
### Interpretation
The diagram likely represents a **state transition system** or **layered process** where:
- **Y+(k-1,0)** (red) and **Y+(k,0)** (purple) are sequential states or phases indexed by "k."
- **C+(k,0)** (yellow) acts as a transitional or overlapping component, offset to indicate a lag or lead in its activation relative to the other states.
- The grid structure implies **discrete, modular interactions**, possibly in computational, engineering, or temporal contexts (e.g., time-series data, multi-stage processes).
The offset positioning of C+(k,0) could symbolize **asynchronous behavior**, **buffering**, or **intermediate processing** between Y+(k-1,0) and Y+(k,0). The absence of numerical values or explicit scales leaves the exact magnitude of the offset ambiguous, but the visual emphasis on spatial separation suggests its functional significance.