# Technical Data Extraction: Performance vs. Effective Context Length
This document provides a detailed technical extraction of the data presented in the provided image, which consists of two side-by-side line charts comparing different Retrieval-Augmented Generation (RAG) configurations.
## 1. General Layout and Metadata
* **Image Type:** Two comparative line charts with logarithmic x-axes.
* **Primary Language:** English.
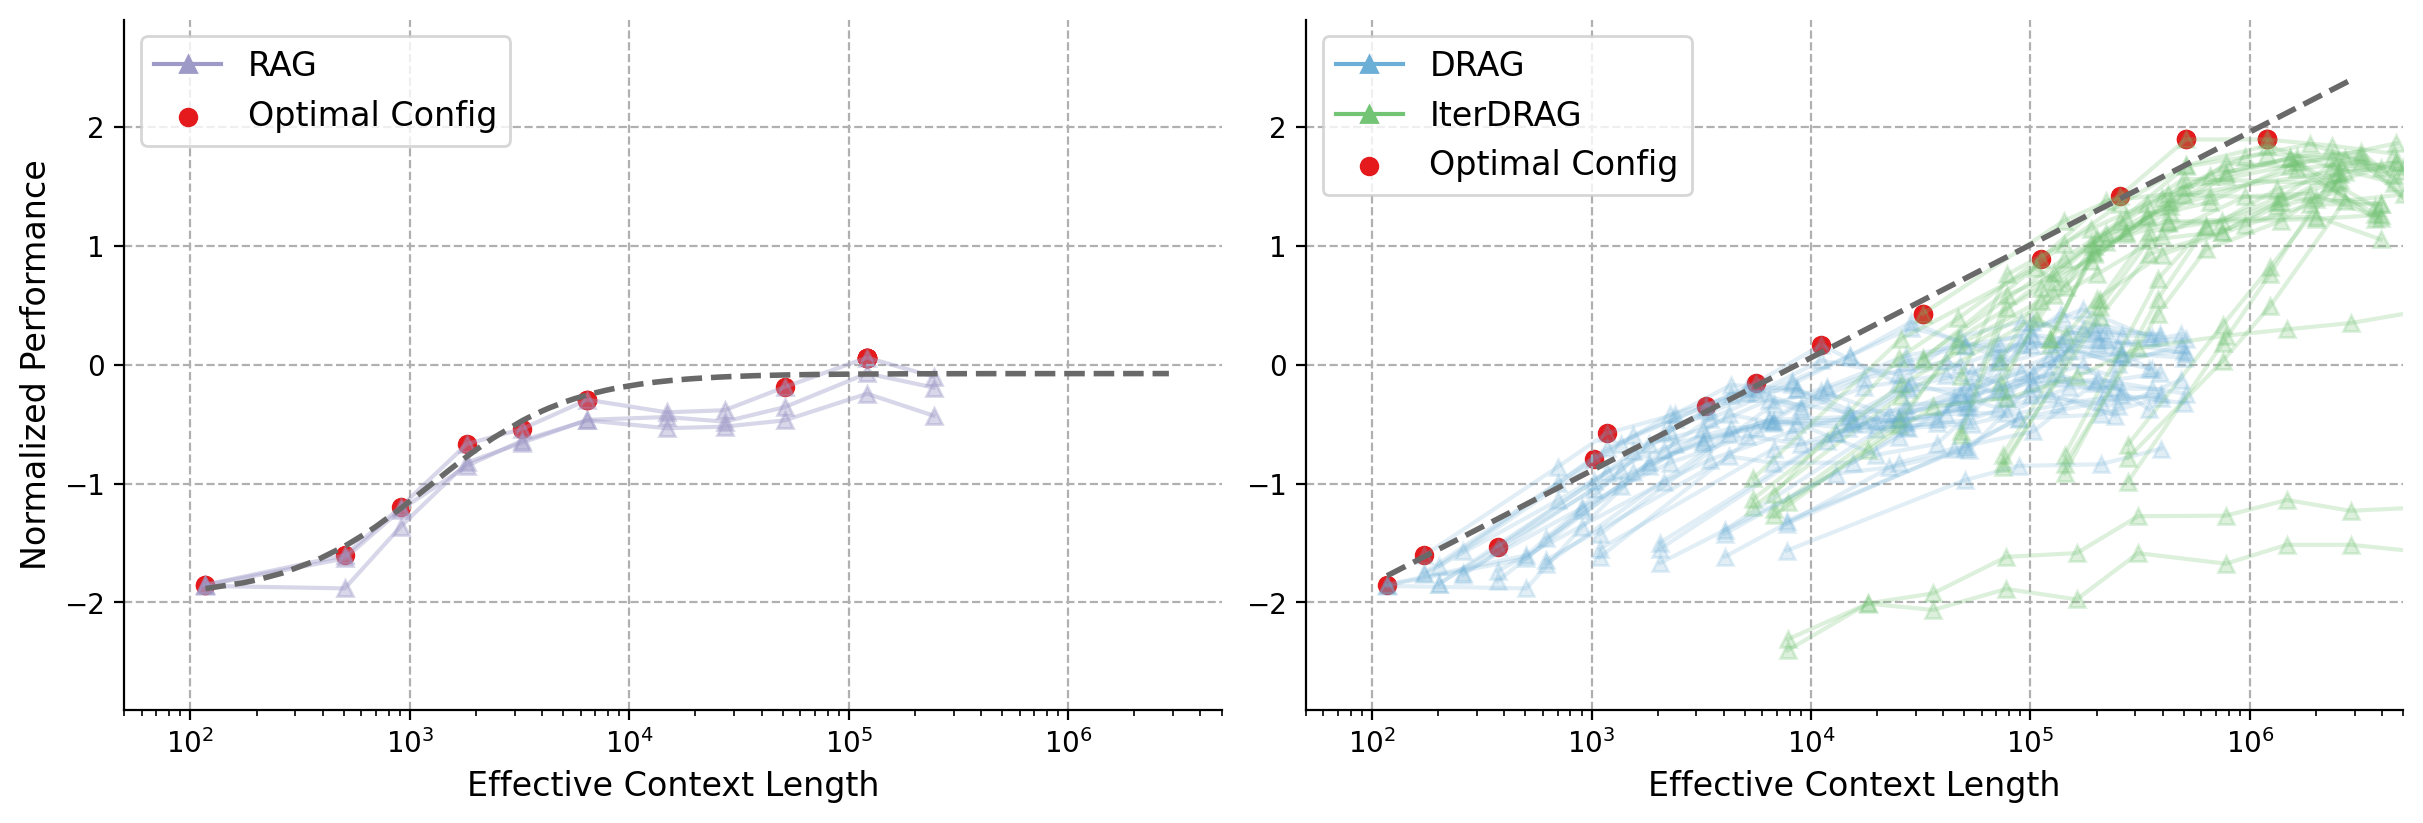
* **Y-Axis (Common):** "Normalized Performance" (Linear scale, ranging from -3 to +3).
* **X-Axis (Common):** "Effective Context Length" (Logarithmic scale, ranging from $10^2$ to approximately $5 \times 10^6$).
* **Visual Elements:** Both charts feature a dashed grey trend line representing the upper bound of performance and red circular markers indicating the "Optimal Config" at various context lengths.
---
## 2. Left Chart: RAG Performance
### Component Isolation: Left Panel
* **Legend Location:** Top-left [x: ~0.05, y: ~0.90].
* **Legend Items:**
* **RAG:** Light purple line with triangle markers ($\triangle$).
* **Optimal Config:** Red circular markers ($\bullet$).
### Data Series Analysis
* **Trend Verification (RAG):** Multiple light purple lines represent different RAG configurations. They show an upward trend from $10^2$ to $10^3$, followed by a plateau or slight decline between $10^4$ and $10^5$, and a final peak near $10^5$ before tapering off.
* **Trend Verification (Optimal Config):** The red dots follow the dashed "frontier" line, showing a steady logarithmic-like increase that plateaus at a Normalized Performance of approximately 0.0.
### Key Data Points (Approximate)
| Effective Context Length | Optimal Config (Red Dot) Performance |
| :--- | :--- |
| $10^2$ | -1.9 |
| $5 \times 10^2$ | -1.6 |
| $10^3$ | -1.2 |
| $2 \times 10^3$ | -0.7 |
| $7 \times 10^3$ | -0.3 |
| $5 \times 10^4$ | -0.2 |
| $1.2 \times 10^5$ | +0.1 |
---
## 3. Right Chart: DRAG and IterDRAG Performance
### Component Isolation: Right Panel
* **Legend Location:** Top-left [x: ~0.55, y: ~0.90].
* **Legend Items:**
* **DRAG:** Light blue line with triangle markers ($\triangle$).
* **IterDRAG:** Light green line with triangle markers ($\triangle$).
* **Optimal Config:** Red circular markers ($\bullet$).
### Data Series Analysis
* **Trend Verification (DRAG - Blue):** These lines generally track the lower-to-middle performance range. They show growth up to $10^5$ context length but generally saturate or decline after reaching a performance level of approximately 0.5.
* **Trend Verification (IterDRAG - Green):** These lines represent higher performance at longer context lengths. While some configurations start late (at $10^4$), they continue to climb as context length increases, reaching performance levels between 1.0 and 2.0.
* **Trend Verification (Optimal Config):** Unlike the left chart, the optimal configuration here does not plateau at 0. It continues a strong upward linear-log trend, reaching nearly 2.0 at $10^6$ context length.
### Key Data Points (Approximate)
| Effective Context Length | Optimal Config (Red Dot) Performance | Dominant Series |
| :--- | :--- | :--- |
| $10^2$ | -1.9 | DRAG |
| $10^3$ | -0.8 | DRAG |
| $10^4$ | +0.2 | DRAG / IterDRAG Transition |
| $10^5$ | +0.9 | IterDRAG |
| $5 \times 10^5$ | +1.9 | IterDRAG |
| $10^6$ | +1.9 | IterDRAG |
---
## 4. Comparative Summary
* **Scaling Limits:** The standard **RAG** (Left) appears to hit a performance ceiling at a Normalized Performance of ~0.0, regardless of increased context length beyond $10^5$.
* **Optimization:** The **DRAG** and **IterDRAG** methods (Right) allow for significantly higher performance scaling. **IterDRAG** specifically is responsible for the performance gains seen at the highest context lengths ($10^5$ to $10^6$), nearly doubling the peak performance of standard RAG.
* **Frontier Line:** The dashed grey line in the right chart has a much steeper slope than the one in the left chart, indicating that the DRAG/IterDRAG architectures utilize additional context much more effectively than standard RAG.