# Technical Document Extraction: Performance Analysis Charts
## Chart 1: RAG vs Optimal Configuration
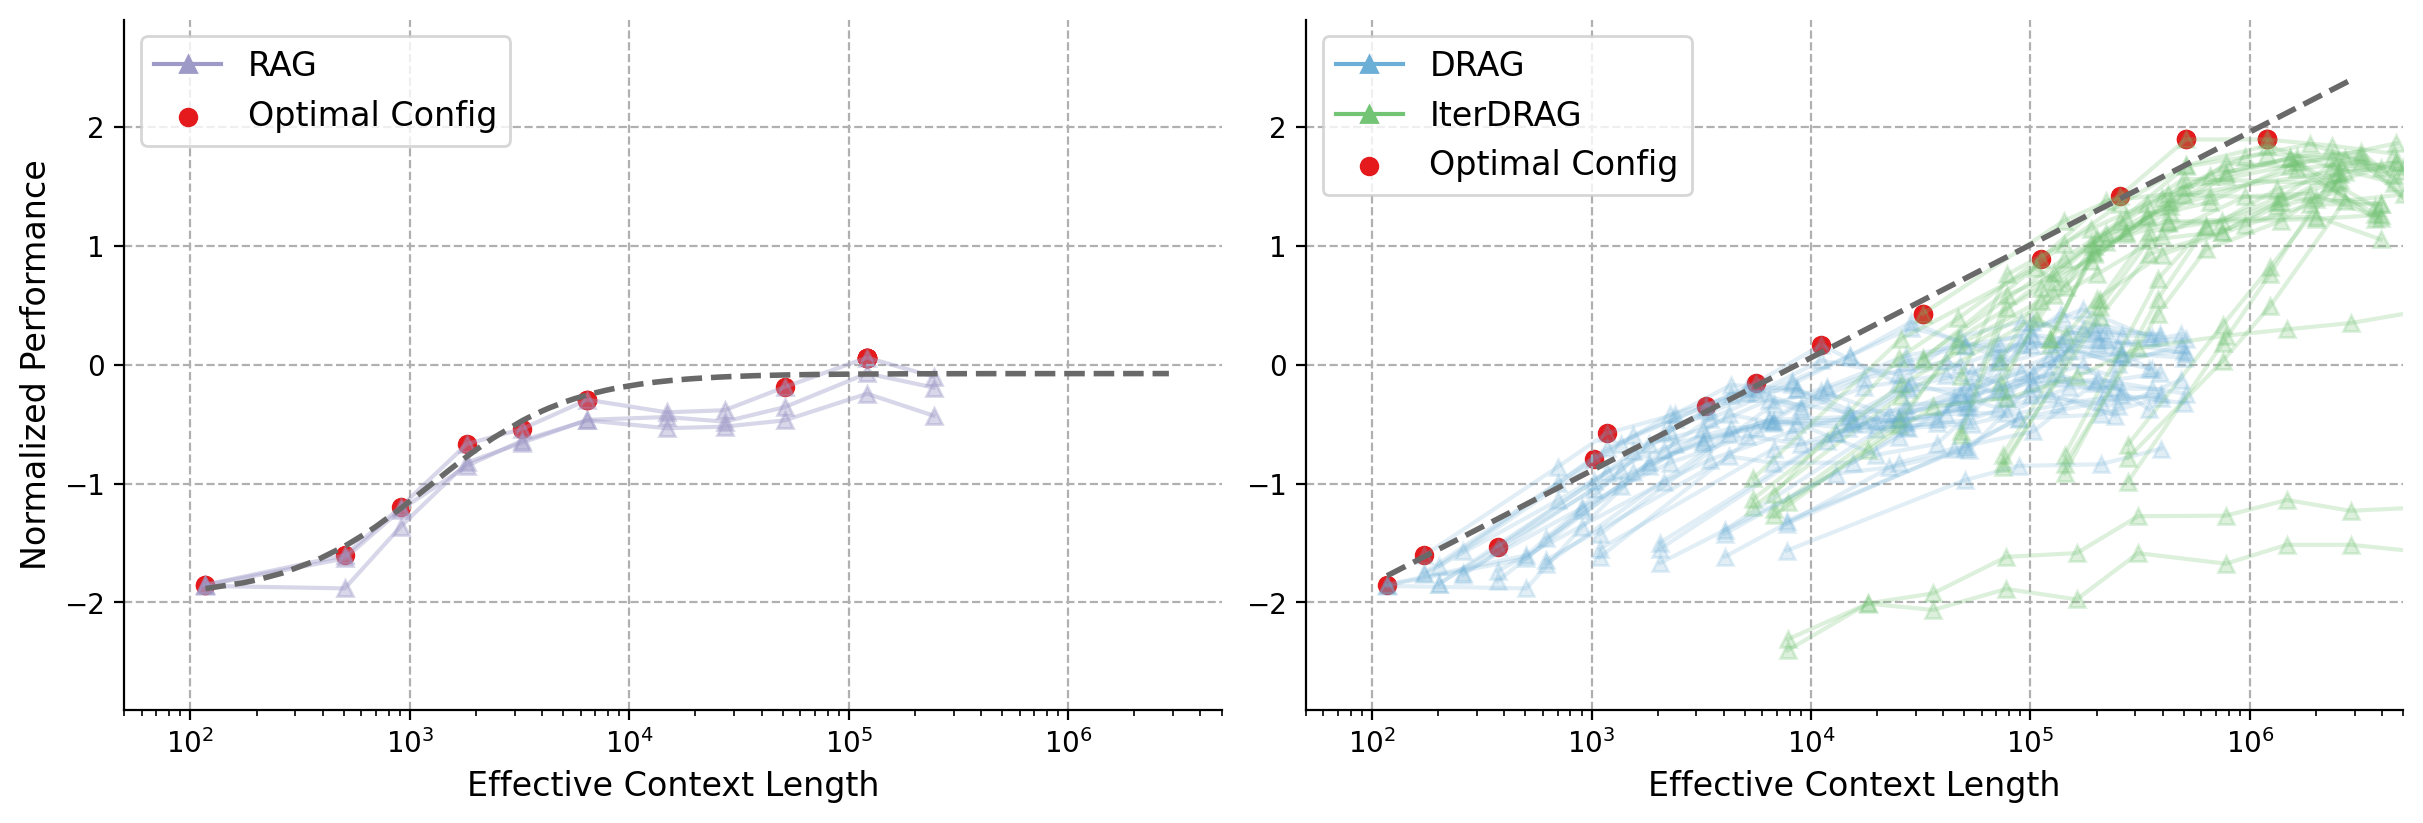
### Spatial Grounding
- **Legend Position**: Top-left corner
- **Legend Colors**:
- Purple: RAG
- Red: Optimal Config
### Axis Labels
- **X-axis**: Effective Context Length (logarithmic scale: 10² to 10⁶)
- **Y-axis**: Normalized Performance (-2 to 2)
### Key Trends
1. **RAG (Purple Line)**:
- Starts at **-2** (10²)
- Gradual increase to **~0** at 10⁵
- Plateaus near **0** at 10⁶
2. **Optimal Config (Red Points)**:
- Begins at **-2.2** (10²)
- Sharp rise to **0.1** at 10⁵
- Declines to **-0.1** at 10⁶
3. **Trend Line (Dashed Black)**:
- Follows RAG's trajectory with slight divergence at 10⁵
### Data Points
| Effective Context Length | RAG Performance | Optimal Config Performance |
|--------------------------|-----------------|----------------------------|
| 10² | -2.0 | -2.2 |
| 10³ | -1.5 | -1.8 |
| 10⁴ | -0.5 | -0.2 |
| 10⁵ | 0.0 | 0.1 |
| 10⁶ | 0.0 | -0.1 |
## Chart 2: DRAg vs IterDRAG vs Optimal Configuration
### Spatial Grounding
- **Legend Position**: Top-left corner
- **Legend Colors**:
- Blue: DRAg
- Green: IterDRAG
- Red: Optimal Config
### Axis Labels
- **X-axis**: Effective Context Length (logarithmic scale: 10² to 10⁶)
- **Y-axis**: Normalized Performance (-2 to 2)
### Key Trends
1. **DRAg (Blue Line)**:
- Starts at **-2** (10²)
- Steady increase to **1.5** at 10⁶
2. **IterDRAG (Green Line)**:
- Begins at **-1.8** (10²)
- Peaks at **1.8** at 10⁶
3. **Optimal Config (Red Points)**:
- Mirrors Chart 1's pattern: **-2.2** → **1.0** → **-0.1**
### Data Points
| Effective Context Length | DRAg Performance | IterDRAG Performance | Optimal Config Performance |
|--------------------------|------------------|----------------------|----------------------------|
| 10² | -2.0 | -1.8 | -2.2 |
| 10³ | -1.0 | -1.2 | -1.8 |
| 10⁴ | 0.0 | 0.2 | -0.2 |
| 10⁵ | 1.0 | 1.2 | 1.0 |
| 10⁶ | 1.5 | 1.8 | -0.1 |
### Component Isolation
1. **Header**: Legends and axis labels
2. **Main Chart**: Data lines and trend lines
3. **Footer**: No additional elements
### Cross-Reference Verification
- All red markers in both charts correspond to "Optimal Config"
- Purple (Chart 1) and blue/green (Chart 2) lines match legend colors
- Dashed lines represent trend lines in both charts
### Observations
- Optimal Config shows non-linear performance with a mid-range peak
- DRAg and IterDRAG demonstrate consistent improvement with scale
- RAG's performance plateaus at large context lengths