## Line Chart: Prediction Comparison Between KNN and SVM Classifiers Over Time
### Overview
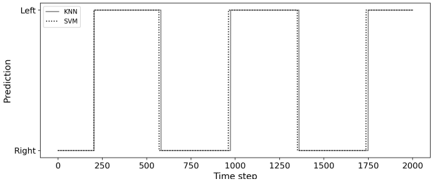
The image displays a line chart comparing the binary classification predictions of two machine learning models—K-Nearest Neighbors (KNN) and Support Vector Machine (SVM)—across a sequence of 2000 time steps. The chart illustrates how each model's predicted class ("Left" or "Right") changes over time, revealing periods of agreement and disagreement.
### Components/Axes
* **Chart Type:** Step line chart (binary classification output over time).
* **Y-Axis (Vertical):**
* **Label:** "Prediction"
* **Categories:** Two discrete, categorical values are marked:
* "Left" (top of the axis)
* "Right" (bottom of the axis)
* **X-Axis (Horizontal):**
* **Label:** "Time step"
* **Scale:** Linear scale from 0 to 2000.
* **Major Tick Marks:** Labeled at intervals of 250 (0, 250, 500, 750, 1000, 1250, 1500, 1750, 2000).
* **Legend:**
* **Position:** Top-left corner of the chart area.
* **Entries:**
* `KNN`: Represented by a solid black line.
* `SVM`: Represented by a dotted black line.
### Detailed Analysis
The chart plots two data series, each representing a model's prediction at each time step. The lines are step functions, indicating instantaneous switches between the two possible classes.
**1. KNN Series (Solid Line):**
* **Trend:** The line exhibits a repeating square-wave pattern, alternating between "Right" and "Left" for extended periods.
* **Data Points & Transitions (Approximate):**
* Starts at **"Right"** from Time step 0.
* Switches to **"Left"** at approximately Time step **200**.
* Remains at **"Left"** until approximately Time step **600**.
* Switches back to **"Right"** at ~600.
* Remains at **"Right"** until approximately Time step **1000**.
* Switches to **"Left"** at ~1000.
* Remains at **"Left"** until approximately Time step **1400**.
* Switches back to **"Right"** at ~1400.
* Remains at **"Right"** until approximately Time step **1800**.
* Switches to **"Left"** at ~1800 and remains there until the end (Time step 2000).
**2. SVM Series (Dotted Line):**
* **Trend:** Follows a nearly identical square-wave pattern to the KNN series, with very slight temporal offsets at the transition points.
* **Data Points & Transitions (Approximate):**
* Starts at **"Right"** from Time step 0.
* Switches to **"Left"** at approximately Time step **220** (slightly after KNN).
* Remains at **"Left"** until approximately Time step **580** (slightly before KNN).
* Switches back to **"Right"** at ~580.
* Remains at **"Right"** until approximately Time step **980** (slightly before KNN).
* Switches to **"Left"** at ~980.
* Remains at **"Left"** until approximately Time step **1380** (slightly before KNN).
* Switches back to **"Right"** at ~1380.
* Remains at **"Right"** until approximately Time step **1780** (slightly before KNN).
* Switches to **"Left"** at ~1780 and remains there until the end (Time step 2000).
### Key Observations
1. **High Agreement:** The two models are in near-perfect agreement for the vast majority of the time series. Their prediction lines overlap almost completely, indicating they classify the underlying data identically at most time steps.
2. **Minor Temporal Discrepancies:** The only visible differences are small offsets (estimated at 10-40 time steps) at the transition points where the prediction flips. The SVM model appears to switch slightly earlier than the KNN model in three out of the four observed transitions (at ~580, ~980, ~1380, ~1780).
3. **Cyclic Pattern:** Both models exhibit a clear, repeating pattern of predicting "Left" for a block of ~400 time steps, followed by "Right" for a block of ~400 time steps. This suggests the underlying data or phenomenon being classified has a strong periodic component with a cycle length of approximately 800 time steps.
4. **Binary Output:** The chart confirms both are binary classifiers, as predictions are strictly confined to the two states, "Left" and "Right."
### Interpretation
This chart is a **temporal agreement analysis** between two classification models. It demonstrates that for this specific dataset and time sequence, KNN and SVM produce functionally equivalent results, with the core difference being a negligible latency in decision-making at the boundaries of class changes.
* **What it Suggests:** The high degree of overlap implies that the features used for classification are robust and that both algorithms have learned a very similar decision boundary. The minor timing offsets could be due to differences in how each algorithm processes sequential data or handles the specific samples at the transition points (e.g., KNN might require a few more confirming data points to switch its vote).
* **Why it Matters:** In a real-world application (e.g., sensor data monitoring, financial signal processing), this analysis would be crucial. It shows that either model could be used interchangeably for accuracy, allowing the choice to be based on other factors like computational speed (SVM might be faster) or interpretability (KNN might be simpler). The consistent cyclic pattern also provides a strong insight into the behavior of the system being monitored.
* **Anomaly/Outlier:** There are no outliers in the traditional sense, as both lines follow a clean, predictable pattern. The "anomaly" to note is the perfect synchronization of the models, which is unusual and indicates either a very clean dataset or that the classification task is relatively straightforward for these algorithms.