## Line Graph: Energy to Solution vs. Problem Size for Optical Implementation and Nvidia Tesla V100
### Overview
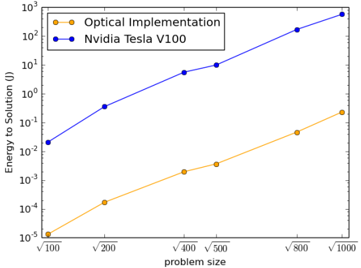
The image is a line graph comparing the energy consumption (in Joules) required to solve computational problems of varying sizes for two methods: "Optical Implementation" and "Nvidia Tesla V100." The x-axis represents problem size (scaled as √100 to √1000), and the y-axis represents energy (logarithmic scale from 10⁻⁵ to 10³ J). Both lines show increasing energy consumption with problem size, but the Nvidia Tesla V100 method exhibits significantly steeper growth.
---
### Components/Axes
- **X-axis (Problem Size)**: Labeled "problem size," with values √100, √200, √400, √500, √800, √1000. These correspond to approximate numerical values: 10, 14.14, 20, 22.36, 28.28, 31.62.
- **Y-axis (Energy to Solution)**: Labeled "Energy to Solution (J)," with a logarithmic scale from 10⁻⁵ to 10³ J.
- **Legend**: Located in the top-right corner, with:
- **Orange line**: "Optical Implementation"
- **Blue line**: "Nvidia Tesla V100"
---
### Detailed Analysis
#### Optical Implementation (Orange Line)
- **Trend**: Starts at 10⁻⁵ J for √100 (10) and increases gradually to 10¹ J for √1000 (31.62).
- **Data Points**:
- √100 (10): ~10⁻⁵ J
- √200 (14.14): ~10⁻⁴ J
- √400 (20): ~10⁻³ J
- √500 (22.36): ~10⁻² J
- √800 (28.28): ~10⁻¹ J
- √1000 (31.62): ~10¹ J
#### Nvidia Tesla V100 (Blue Line)
- **Trend**: Starts at 10⁻² J for √100 (10) and increases sharply to 10³ J for √1000 (31.62).
- **Data Points**:
- √100 (10): ~10⁻² J
- √200 (14.14): ~10⁻¹ J
- √400 (20): ~10⁰ J (1 J)
- √500 (22.36): ~10¹ J
- √800 (28.28): ~10² J
- √1000 (31.62): ~10³ J
---
### Key Observations
1. **Exponential Growth**: Both methods show energy consumption increasing with problem size, but the Nvidia Tesla V100 line rises exponentially faster.
2. **Efficiency Gap**: At √1000 (31.62), the Nvidia method consumes ~100 times more energy (10³ J) than the Optical Implementation (10¹ J).
3. **Log Scale Impact**: The logarithmic y-axis emphasizes the disparity in energy efficiency between the two methods, particularly at larger problem sizes.
---
### Interpretation
- **Energy Efficiency**: The Optical Implementation demonstrates significantly lower energy consumption across all problem sizes, suggesting it is more scalable for large computations.
- **Nvidia Scalability Concerns**: The steep rise in energy use for the Nvidia Tesla V100 implies potential limitations in real-world applications requiring high problem sizes, such as AI training or scientific simulations.
- **Practical Implications**: The data highlights the importance of algorithmic efficiency (e.g., optical methods) over raw hardware power (e.g., GPUs) for sustainable large-scale computing.
---
### Spatial Grounding & Verification
- **Legend Placement**: Top-right corner, clearly associating colors with methods.
- **Color Consistency**: Orange line matches "Optical Implementation"; blue line matches "Nvidia Tesla V100."
- **Axis Labels**: All axis markers and titles are legible and unambiguous.
---
### Content Details
- **No Outliers**: Both lines follow smooth, predictable trends without anomalies.
- **Data Precision**: Values are approximate due to logarithmic scaling and lack of exact numerical labels on the graph.