\n
## Bar Chart: Performance Comparison by Step Count
### Overview
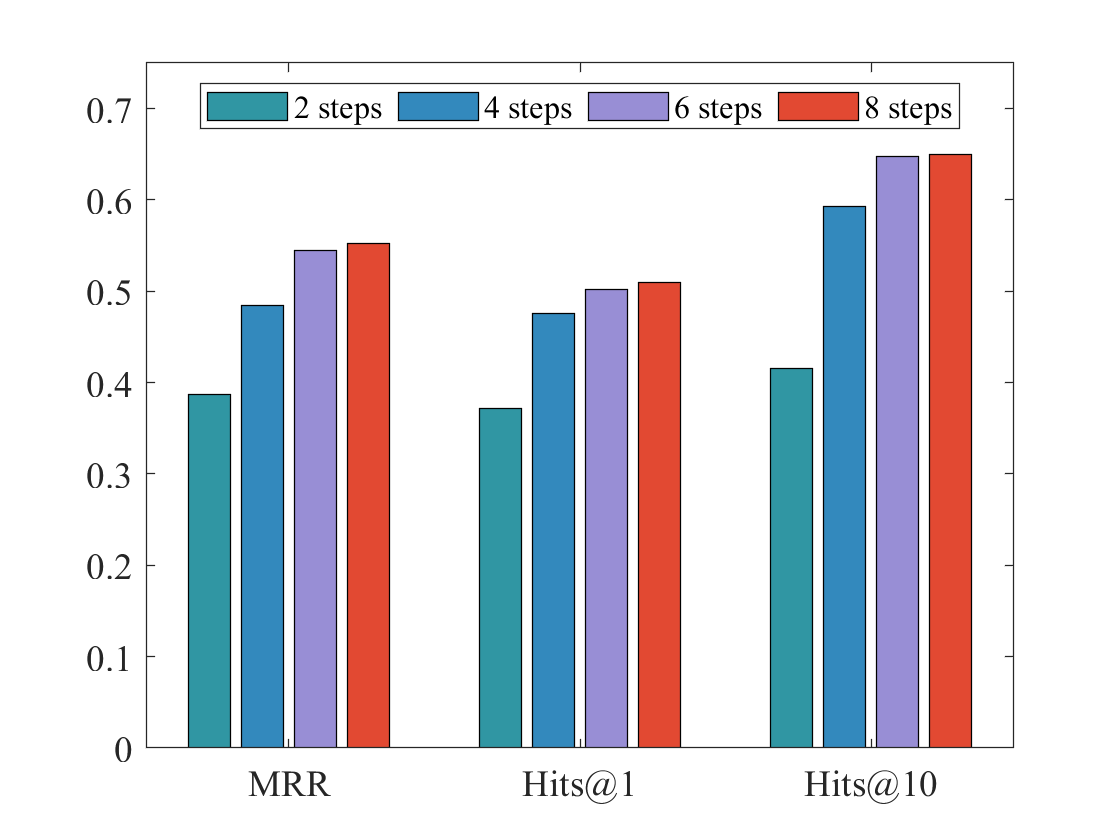
This image presents a bar chart comparing the performance of a system across different numbers of steps (2, 4, 6, and 8) for three different metrics: MRR (Mean Reciprocal Rank), Hits@1, and Hits@10. The chart uses colored bars to represent each step count for each metric, allowing for a visual comparison of performance.
### Components/Axes
* **X-axis:** Represents the evaluation metrics: "MRR", "Hits@1", and "Hits@10".
* **Y-axis:** Represents the performance score, ranging from 0.0 to 0.7, with increments of 0.1.
* **Legend (Top-Center):**
* "2 steps" - Teal/Cyan color
* "4 steps" - Blue color
* "6 steps" - Purple/Lavender color
* "8 steps" - Red color
### Detailed Analysis
The chart consists of three groups of four bars each, corresponding to the three metrics on the x-axis. Each group compares the performance of the system using 2, 4, 6, and 8 steps.
**MRR:**
* 2 steps: Approximately 0.41
* 4 steps: Approximately 0.49
* 6 steps: Approximately 0.54
* 8 steps: Approximately 0.56
*Trend:* The bars for MRR show an upward trend as the number of steps increases.
**Hits@1:**
* 2 steps: Approximately 0.39
* 4 steps: Approximately 0.48
* 6 steps: Approximately 0.52
* 8 steps: Approximately 0.55
*Trend:* The bars for Hits@1 also show an upward trend as the number of steps increases.
**Hits@10:**
* 2 steps: Approximately 0.44
* 4 steps: Approximately 0.56
* 6 steps: Approximately 0.59
* 8 steps: Approximately 0.65
*Trend:* The bars for Hits@10 demonstrate a clear upward trend as the number of steps increases.
### Key Observations
* Increasing the number of steps consistently improves performance across all three metrics.
* The largest performance gains are observed when increasing from 2 to 4 steps. The improvement from 6 to 8 steps is less pronounced, but still positive.
* Hits@10 consistently has the highest scores, indicating that the system is more effective at retrieving relevant items within the top 10 results.
* MRR has the lowest scores, suggesting that the ranking of the top results could be improved.
### Interpretation
The data suggests that increasing the number of steps in the system's process leads to improved retrieval performance, as measured by MRR, Hits@1, and Hits@10. This could indicate that more complex or iterative processing yields better results. The diminishing returns observed when moving from 6 to 8 steps suggest that there may be a point of diminishing returns, where further increasing the number of steps does not significantly improve performance. The differences between the metrics suggest that the system is better at identifying relevant items within a larger set (Hits@10) than at ranking the most relevant item at the very top (MRR). This could be due to factors such as the quality of the ranking algorithm or the nature of the data being searched. The chart provides valuable insights into the relationship between processing complexity and retrieval performance, which can be used to optimize the system for specific performance goals.