## Bar Chart: Performance Metrics Across Step Configurations
### Overview
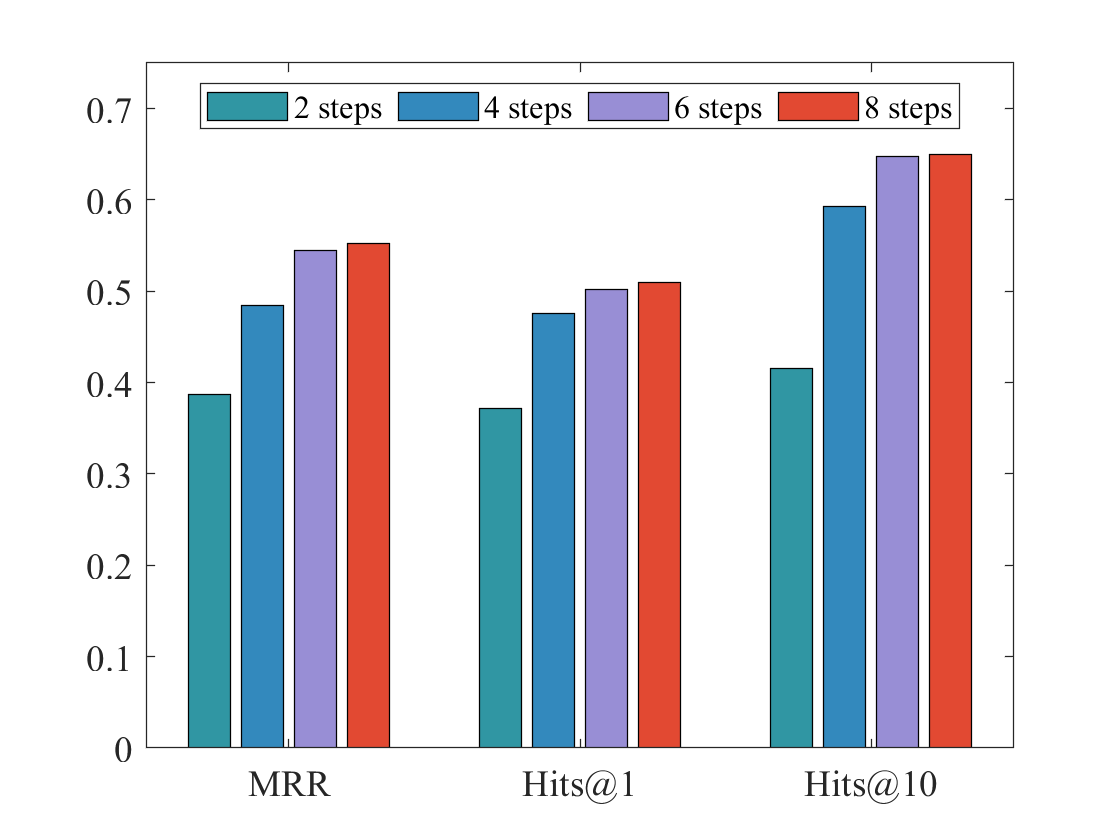
The chart compares performance metrics (MRR, Hits@1, Hits@10) across four step configurations (2, 4, 6, 8 steps) using grouped bars. Each metric is measured on a 0-0.7 scale, with distinct color coding for step configurations.
### Components/Axes
- **X-axis**: Three categories - MRR, Hits@1, Hits@10 (left to right)
- **Y-axis**: Numeric scale from 0 to 0.7 in 0.1 increments
- **Legend**: Located at top-right, mapping colors to step configurations:
- Teal: 2 steps
- Blue: 4 steps
- Purple: 6 steps
- Red: 8 steps
- **Bar Structure**: Four bars per category, ordered by step count (left to right)
### Detailed Analysis
1. **MRR Category**:
- 2 steps: ~0.40 (teal)
- 4 steps: ~0.49 (blue)
- 6 steps: ~0.55 (purple)
- 8 steps: ~0.56 (red)
- *Trend*: Steady increase with diminishing returns (0.01 gain between 6-8 steps)
2. **Hits@1 Category**:
- 2 steps: ~0.38 (teal)
- 4 steps: ~0.48 (blue)
- 6 steps: ~0.50 (purple)
- 8 steps: ~0.51 (red)
- *Trend*: Consistent growth with plateauing at higher steps
3. **Hits@10 Category**:
- 2 steps: ~0.42 (teal)
- 4 steps: ~0.60 (blue)
- 6 steps: ~0.65 (purple)
- 8 steps: ~0.66 (red)
- *Trend*: Significant jump between 2-4 steps, then gradual improvement
### Key Observations
- **Performance Correlation**: All metrics show improvement with more steps, but Hits@10 demonstrates the strongest step-configuration dependency
- **Diminishing Returns**: MRR and Hits@1 show minimal gains after 6 steps
- **Color Consistency**: Legend colors perfectly match bar colors across all categories
- **Scale Utilization**: Y-axis fully utilizes range (0-0.7) with no empty space
### Interpretation
The data suggests that increasing computational steps improves performance metrics, with Hits@10 showing the most pronounced benefits. The diminishing returns observed in MRR and Hits@1 after 6 steps indicate potential optimization opportunities. The chart implies a trade-off between computational cost (steps) and performance gains, particularly evident in the Hits@10 metric where 4 steps already achieve 60% of maximum performance. This pattern could inform resource allocation decisions in systems where step configuration impacts efficiency.