## Line Charts with Insets: Overlaps vs. HMC Steps for Five Replicas
### Overview
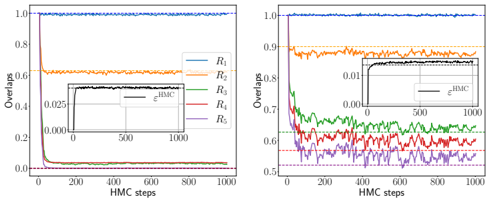
The image displays two side-by-side line charts, each plotting "Overlaps" against "HMC steps" for five distinct data series labeled R₁ through R₅. Both charts share the same x-axis range (0 to 1000 steps) but differ in their y-axis scales, with the right chart providing a zoomed-in view of the upper portion of the data. Each main chart contains an inset graph plotting a related metric, ε^HMC, over the same HMC steps.
### Components/Axes
**Main Charts (Left and Right):**
* **Y-axis:** Labeled "Overlaps". The left chart's scale runs from 0.0 to 1.0. The right chart's scale runs from 0.5 to 1.0.
* **X-axis:** Labeled "HMC steps" for both charts, with major tick marks at 0, 200, 400, 600, 800, and 1000.
* **Legend:** Located in the top-right corner of the left chart. It identifies five colored lines:
* R₁: Blue line
* R₂: Orange line
* R₃: Green line
* R₄: Red line
* R₅: Purple line
* **Data Series:** Five lines, one for each replica (R₁-R₅), showing the evolution of their "Overlaps" metric over 1000 HMC steps.
**Inset Charts (within each main chart):**
* **Location:** Centered within the main plot area.
* **Y-axis:** Labeled "ε^HMC". The left inset scale runs from 0.000 to 0.025. The right inset scale runs from 0.00 to 0.01.
* **X-axis:** Labeled "HMC steps", with ticks at 0, 500, and 1000.
* **Data Series:** A single black line in each inset, showing the trend of ε^HMC.
### Detailed Analysis
**Left Chart (Full Y-axis Range: 0.0 to 1.0):**
* **R₁ (Blue):** Starts near 1.0 and remains very close to 1.0 throughout all 1000 steps, showing minimal fluctuation.
* **R₂ (Orange):** Starts near 1.0, drops rapidly within the first ~50 steps to approximately 0.6, and then stabilizes with minor fluctuations around that level.
* **R₃ (Green), R₄ (Red), R₅ (Purple):** All start near 1.0 and exhibit a very sharp, near-vertical drop within the first ~20-30 steps to values near 0.0. They then remain very close to 0.0 for the remainder of the steps, with R₅ showing slightly more noise than R₃ and R₄.
* **Inset (ε^HMC):** The black line starts near 0.000 and shows a rapid initial increase, followed by a slower, noisy rise, reaching approximately 0.025 by step 1000.
**Right Chart (Zoomed Y-axis Range: 0.5 to 1.0):**
* **R₁ (Blue):** Confirms the trend from the left chart, staying consistently near the top of the scale (~1.0).
* **R₂ (Orange):** Clearly stabilizes in the range of approximately 0.88 to 0.92 after the initial drop.
* **R₃ (Green):** After its initial drop (not fully visible on this scale), it fluctuates noisily in the range of approximately 0.60 to 0.68.
* **R₄ (Red):** Fluctuates noisily in the range of approximately 0.55 to 0.62.
* **R₅ (Purple):** Fluctuates noisily in the range of approximately 0.52 to 0.58, generally sitting below R₄.
* **Inset (ε^HMC):** The black line shows a similar trend to the left inset but on a finer scale, starting near 0.00 and rising to approximately 0.01 by step 1000.
### Key Observations
1. **Clear Hierarchy:** A stable performance hierarchy is established quickly and maintained: R₁ > R₂ > R₃ > R₄ > R₅ in terms of sustained Overlap values.
2. **Two-Phase Behavior:** All series (except R₁) exhibit a rapid initial transient phase (sharp drop) followed by a noisy steady-state phase.
3. **Convergence of ε^HMC:** The inset metric ε^HMC shows a consistent increasing trend in both plots, suggesting a cumulative error or deviation metric that grows with simulation steps.
4. **Scale-Dependent Perception:** The right chart's zoomed view reveals significant structure and noise in the steady-state behavior of R₃, R₄, and R₅ that appears as near-zero flat lines on the left chart's full scale.
### Interpretation
These charts likely visualize the performance of different replicas (R₁-R₅) in a Hamiltonian Monte Carlo (HMC) simulation or a similar iterative sampling/optimization process. "Overlaps" probably measures the similarity or fidelity of a replica's state to a target distribution or a reference state.
* **R₁ (Blue)** demonstrates excellent, stable performance, maintaining near-perfect overlap throughout. This could be a well-tuned or reference replica.
* **R₂ (Orange)** shows good but slightly degraded performance, stabilizing at a high overlap (~0.9).
* **R₃, R₄, R₅ (Green, Red, Purple)** show progressively worse performance, stabilizing at lower overlap values with higher noise. This could indicate issues with tuning, initialization, or inherent difficulty in sampling certain regions of the state space.
* The **inset ε^HMC** likely tracks an error metric (e.g., energy error, integration error) inherent to the HMC algorithm. Its steady increase suggests a gradual drift or accumulation of error over long simulations, which is a known characteristic of numerical integrators. The fact that its growth is shown alongside the overlaps implies a potential correlation between increasing numerical error and the stability/performance of the replicas.
* The **dual-chart presentation** is a deliberate technical choice to show both the full dynamic range (left, highlighting the dramatic initial drops) and the detailed steady-state behavior (right, highlighting the performance hierarchy and noise). This reveals that while R₃-R₅ appear to fail (overlap ~0) on a broad scale, they actually maintain a non-zero, albeit low and noisy, overlap in a more focused view.