## Line Graphs: Overlap Trends Across HMC Steps
### Overview
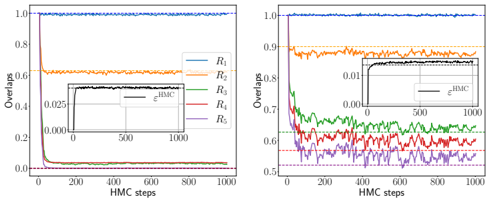
Two side-by-side line graphs depict the evolution of overlap metrics (y-axis) across Hamiltonian Monte Carlo (HMC) steps (x-axis). Both graphs include five labeled data series (R₁–R₅) and a reference line (ε_HMC). The left graph shows convergence toward ε_HMC, while the right graph exhibits divergent behavior.
---
### Components/Axes
#### Left Graph
- **X-axis**: "HMC steps" (0–1000, linear scale)
- **Y-axis**: "Overlaps" (0.0–1.0, linear scale)
- **Legend**: Located in the upper-right corner, mapping colors to labels:
- R₁: Blue
- R₂: Orange
- R₃: Green
- R₄: Red
- R₅: Purple
- ε_HMC: Black dashed line
- **Inset**: Zoomed view of ε_HMC (x: 0–1000, y: 0.0–0.025)
#### Right Graph
- **X-axis**: "HMC steps" (0–1000, linear scale)
- **Y-axis**: "Overlaps" (0.5–1.0, linear scale)
- **Legend**: Same color-to-label mapping as the left graph.
- **Inset**: Zoomed view of ε_HMC (x: 0–1000, y: 0.0–0.01)
---
### Detailed Analysis
#### Left Graph
- **R₁ (Blue)**: Starts at ~1.0, remains flat throughout.
- **R₂ (Orange)**: Drops sharply to ~0.6 by step 50, then stabilizes.
- **R₃ (Green)**: Drops sharply to ~0.4 by step 50, then stabilizes.
- **R₄ (Red)**: Drops sharply to ~0.2 by step 50, then stabilizes.
- **R₅ (Purple)**: Drops sharply to ~0.2 by step 50, then stabilizes.
- **ε_HMC (Black Dashed)**: Remains near 0.0 throughout, with minor fluctuations (~0.000–0.0025) visible in the inset.
#### Right Graph
- **R₁ (Blue)**: Stays near 1.0 with minor noise (~0.99–1.0).
- **R₂ (Orange)**: Drops sharply to ~0.9 by step 50, then fluctuates (~0.85–0.95).
- **R₃ (Green)**: Drops sharply to ~0.7 by step 50, then fluctuates (~0.65–0.75).
- **R₄ (Red)**: Drops sharply to ~0.6 by step 50, then fluctuates (~0.55–0.65).
- **R₅ (Purple)**: Drops sharply to ~0.5 by step 50, then fluctuates (~0.45–0.55).
- **ε_HMC (Black Dashed)**: Remains near 0.0 throughout, with minor fluctuations (~0.000–0.001) visible in the inset.
---
### Key Observations
1. **Convergence vs. Divergence**:
- Left graph: All R₁–R₅ converge to ε_HMC by step 50.
- Right graph: R₁–R₅ diverge from ε_HMC, with increasing variability over time.
2. **ε_HMC Behavior**:
- Left inset: ε_HMC stabilizes at ~0.000–0.0025.
- Right inset: ε_HMC stabilizes at ~0.000–0.001.
3. **Line Stability**:
- Left graph lines are smoother post-step 50.
- Right graph lines exhibit persistent oscillations.
---
### Interpretation
The graphs suggest contrasting dynamics in overlap metrics under HMC:
- **Left Graph**: Indicates a stable system where all R₁–R₅ align with ε_HMC, possibly reflecting a well-conditioned optimization problem.
- **Right Graph**: Suggests instability or sensitivity in R₁–R₅, with ε_HMC remaining negligible. This could imply a poorly conditioned system or external perturbations affecting R₁–R₅.
- **ε_HMC Role**: Acts as a reference baseline, with its near-zero value indicating minimal overlap in the reference metric across steps.
The divergence in the right graph raises questions about parameter sensitivity or model robustness, warranting further investigation into the underlying HMC configuration or data distribution.