## Line Chart: Accuracy vs. Steps for Different Difficulty Levels
### Overview
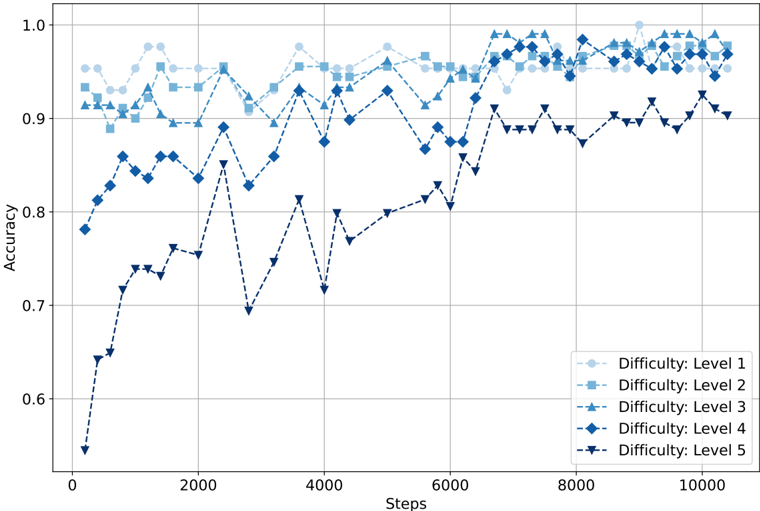
The image is a line chart showing the accuracy of a model over a number of steps for five different difficulty levels. The x-axis represents the number of steps, ranging from 0 to 10000. The y-axis represents the accuracy, ranging from 0.6 to 1.0. Each line represents a different difficulty level, with lighter shades of blue indicating lower difficulty levels and darker shades indicating higher difficulty levels.
### Components/Axes
* **X-axis:** "Steps", ranging from 0 to 10000, with gridlines at intervals of 2000.
* **Y-axis:** "Accuracy", ranging from 0.6 to 1.0, with gridlines at intervals of 0.1.
* **Legend:** Located in the bottom-right corner, it identifies each line by its difficulty level:
* Difficulty: Level 1 (lightest blue, square markers)
* Difficulty: Level 2 (light blue, square markers)
* Difficulty: Level 3 (medium blue, triangle markers)
* Difficulty: Level 4 (dark blue, diamond markers)
* Difficulty: Level 5 (darkest blue, inverted triangle markers)
### Detailed Analysis
* **Difficulty: Level 1 (lightest blue, square markers):** The line starts at approximately 0.92 accuracy and fluctuates between 0.92 and 0.98 throughout the steps. The trend is relatively stable.
* Step 0: ~0.92
* Step 2000: ~0.96
* Step 4000: ~0.93
* Step 6000: ~0.95
* Step 8000: ~0.93
* Step 10000: ~0.96
* **Difficulty: Level 2 (light blue, square markers):** The line starts at approximately 0.92 accuracy and fluctuates between 0.90 and 0.98 throughout the steps. The trend is relatively stable.
* Step 0: ~0.92
* Step 2000: ~0.92
* Step 4000: ~0.91
* Step 6000: ~0.93
* Step 8000: ~0.92
* Step 10000: ~0.94
* **Difficulty: Level 3 (medium blue, triangle markers):** The line starts at approximately 0.92 accuracy and fluctuates between 0.88 and 0.98 throughout the steps. The trend is relatively stable.
* Step 0: ~0.92
* Step 2000: ~0.90
* Step 4000: ~0.90
* Step 6000: ~0.88
* Step 8000: ~0.96
* Step 10000: ~0.92
* **Difficulty: Level 4 (dark blue, diamond markers):** The line starts at approximately 0.78 accuracy and generally increases until it stabilizes around 0.90 after approximately 7000 steps.
* Step 0: ~0.78
* Step 2000: ~0.86
* Step 4000: ~0.84
* Step 6000: ~0.87
* Step 8000: ~0.94
* Step 10000: ~0.94
* **Difficulty: Level 5 (darkest blue, inverted triangle markers):** The line starts at approximately 0.55 accuracy and increases until it stabilizes around 0.90 after approximately 7000 steps. The line has significant fluctuations before stabilizing.
* Step 0: ~0.55
* Step 2000: ~0.75
* Step 4000: ~0.72
* Step 6000: ~0.82
* Step 8000: ~0.90
* Step 10000: ~0.92
### Key Observations
* The accuracy generally increases with the number of steps, especially for higher difficulty levels (4 and 5).
* The accuracy for lower difficulty levels (1, 2, and 3) remains relatively stable throughout the steps.
* Difficulty levels 4 and 5 show a significant improvement in accuracy over the steps, indicating that the model learns and adapts to the higher difficulty levels.
* The model achieves similar accuracy levels for all difficulty levels after a sufficient number of steps (around 8000-10000).
### Interpretation
The chart demonstrates the learning process of a model across different difficulty levels. The model initially struggles with higher difficulty levels (4 and 5), as indicated by the lower accuracy at the beginning. However, as the number of steps increases, the model learns and improves its accuracy, eventually reaching similar levels as the lower difficulty levels. This suggests that the model is capable of adapting to different levels of complexity given enough training. The stable accuracy for lower difficulty levels indicates that the model has already mastered these levels and does not require further learning. The data suggests that increasing the number of training steps can improve the model's performance on more challenging tasks.