\n
## Line Chart: Accuracy vs. Steps for Different Difficulty Levels
### Overview
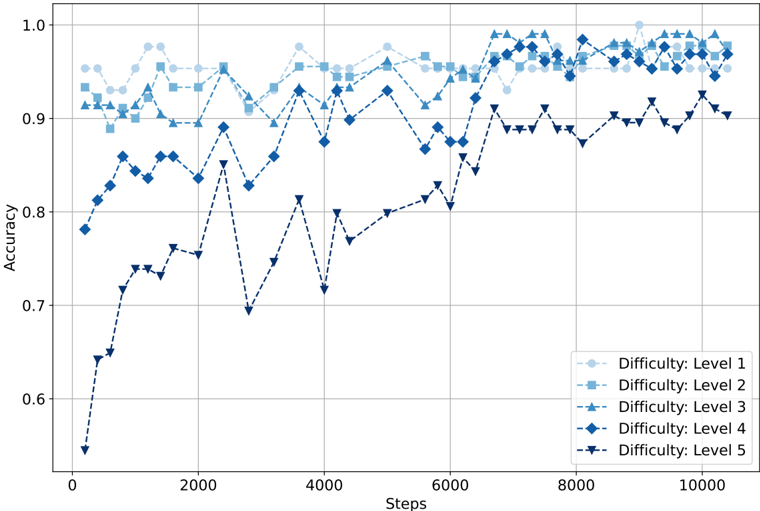
This image presents a line chart illustrating the relationship between 'Accuracy' and 'Steps' for five different 'Difficulty' levels. The chart displays how accuracy changes as the number of steps increases, with each difficulty level represented by a distinct line. The chart appears to be tracking the performance of a learning algorithm or process.
### Components/Axes
* **X-axis:** Labeled "Steps", ranging from approximately 0 to 10000. The scale is linear.
* **Y-axis:** Labeled "Accuracy", ranging from approximately 0.6 to 1.0. The scale is linear.
* **Legend:** Located in the bottom-right corner of the chart. It identifies five difficulty levels:
* Difficulty: Level 1 (Lightest Blue, dashed line with circle markers)
* Difficulty: Level 2 (Medium Blue, dashed line with circle markers)
* Difficulty: Level 3 (Darker Blue, dashed line with circle markers)
* Difficulty: Level 4 (Dark Blue, solid line with triangle markers)
* Difficulty: Level 5 (Darkest Blue, dashed-dotted line with square markers)
* **Gridlines:** Present to aid in reading values.
### Detailed Analysis
Here's a breakdown of each difficulty level's trend and approximate data points:
* **Difficulty: Level 1 (Lightest Blue):** The line starts at approximately 0.92 accuracy at 0 steps. It fluctuates between approximately 0.90 and 0.98 throughout the entire range of steps, showing minimal change.
* **Difficulty: Level 2 (Medium Blue):** Starts at approximately 0.91 accuracy at 0 steps. It exhibits similar fluctuations to Level 1, remaining mostly between 0.90 and 0.98.
* **Difficulty: Level 3 (Darker Blue):** Starts at approximately 0.91 accuracy at 0 steps. It fluctuates between approximately 0.88 and 0.98.
* **Difficulty: Level 4 (Dark Blue):** Starts at approximately 0.85 accuracy at 0 steps. It shows a clear upward trend initially, reaching approximately 0.94 accuracy around 2000 steps. It then fluctuates between approximately 0.90 and 0.96.
* **Difficulty: Level 5 (Darkest Blue):** Starts at approximately 0.6 accuracy at 0 steps. It exhibits a strong upward trend initially, reaching approximately 0.85 accuracy around 2000 steps. It then fluctuates between approximately 0.78 and 0.90.
### Key Observations
* Levels 1, 2, and 3 demonstrate consistently high accuracy (above 0.90) throughout the entire range of steps.
* Level 5 shows the most significant improvement in accuracy as the number of steps increases, starting from the lowest initial accuracy.
* Level 4 shows a moderate improvement in accuracy with increasing steps.
* All lines exhibit some degree of fluctuation, suggesting that accuracy is not perfectly stable.
* The initial accuracy for Level 5 is significantly lower than the other levels.
### Interpretation
The data suggests that the difficulty level significantly impacts the initial accuracy and the rate of learning. Higher difficulty levels (specifically Level 5) require more steps to achieve comparable accuracy to lower difficulty levels. The relatively stable accuracy of Levels 1-3 indicates that the algorithm or process quickly converges to a high level of performance for these difficulties. The fluctuations observed in all lines could be due to the inherent stochasticity of the learning process or the presence of noise in the data. The chart demonstrates a learning curve, where accuracy generally increases with the number of steps, but the rate of improvement varies depending on the difficulty of the task. The fact that Level 5 starts lower and improves more suggests it is a more complex task that requires more training.