TECHNICAL ASSET FINGERPRINT
26c75c1187c23aef54194222
Click to view fullscreen
Press ESC or click to close
FOUND IN PAPERS
EXPERT: healer-alpha-free VERSION 1
RUNTIME: free/openrouter/healer-alpha
INTEL_VERIFIED
## Line Chart: Accuracy vs. Training Steps by Difficulty Level
### Overview
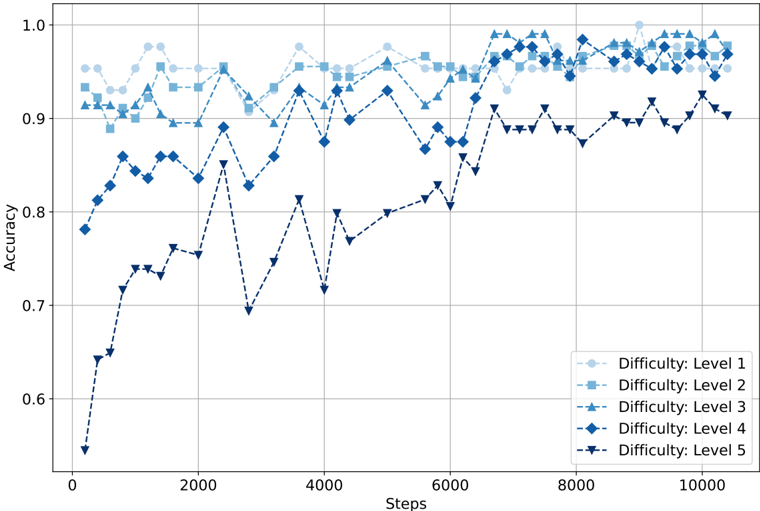
The image displays a line chart plotting model accuracy against training steps for five distinct difficulty levels. The chart illustrates how performance evolves over the course of training, with each difficulty level represented by a unique line style and marker. The overall trend shows that accuracy generally increases with more training steps for all levels, though the starting points, rates of improvement, and final performance vary significantly.
### Components/Axes
* **Chart Type:** Multi-series line chart with markers.
* **X-Axis:**
* **Label:** "Steps"
* **Scale:** Linear, ranging from 0 to approximately 10,500.
* **Major Tick Marks:** Labeled at 0, 2000, 4000, 6000, 8000, 10000.
* **Y-Axis:**
* **Label:** "Accuracy"
* **Scale:** Linear, ranging from approximately 0.55 to 1.0.
* **Major Tick Marks:** Labeled at 0.6, 0.7, 0.8, 0.9, 1.0.
* **Legend:**
* **Position:** Bottom-right corner of the chart area.
* **Content:** Five entries, each defining a "Difficulty" level with a corresponding line style and marker.
* **Entries (from top to bottom as listed in legend):**
1. `Difficulty: Level 1` - Light blue (#a6cee3 approx.) dashed line with circle markers.
2. `Difficulty: Level 2` - Light blue (#a6cee3 approx.) dashed line with square markers.
3. `Difficulty: Level 3` - Medium blue (#1f78b4 approx.) dashed line with upward-pointing triangle markers.
4. `Difficulty: Level 4` - Dark blue (#08519c approx.) dashed line with diamond markers.
5. `Difficulty: Level 5` - Very dark blue (#08306b approx.) dashed line with downward-pointing triangle markers.
* **Grid:** Light gray grid lines are present for both major x and y ticks.
### Detailed Analysis
**Trend Verification & Data Point Extraction (Approximate Values):**
* **Difficulty: Level 1 (Light blue circles):**
* **Trend:** Starts very high, exhibits minor fluctuations but remains consistently high and stable throughout training.
* **Key Points:** Begins near 0.95 accuracy at step ~200. Maintains a range between ~0.94 and ~0.98 for the entire duration. Ends near 0.97 at step ~10,500.
* **Difficulty: Level 2 (Light blue squares):**
* **Trend:** Starts high, similar to Level 1 but slightly lower. Shows a very gradual, slight upward trend with minimal volatility.
* **Key Points:** Begins near 0.93 at step ~200. Slowly climbs, staying mostly between 0.93 and 0.96. Ends near 0.96 at step ~10,500.
* **Difficulty: Level 3 (Medium blue upward triangles):**
* **Trend:** Starts moderately high, shows a clear upward trend with noticeable fluctuations. Performance converges with Levels 1 and 2 in the later stages.
* **Key Points:** Begins near 0.91 at step ~200. Experiences dips (e.g., ~0.89 at step ~2000) and rises. Crosses above 0.95 around step ~6500 and remains in the 0.95-0.98 range thereafter.
* **Difficulty: Level 4 (Dark blue diamonds):**
* **Trend:** Starts significantly lower than Levels 1-3. Exhibits high volatility with sharp peaks and troughs in the first half of training, followed by a strong upward trend and reduced volatility in the second half.
* **Key Points:** Begins near 0.78 at step ~200. Sharp rise to ~0.86 by step ~1000. Major dip to ~0.72 around step ~4000. Strong recovery, crossing 0.90 around step ~6000. Ends in the 0.94-0.97 range, close to the top three levels.
* **Difficulty: Level 5 (Very dark blue downward triangles):**
* **Trend:** Starts the lowest of all levels. Shows the most dramatic and consistent upward slope throughout training, indicating the greatest relative improvement. Remains the lowest-performing level at the end.
* **Key Points:** Begins near 0.55 at step ~200. Steep climb to ~0.74 by step ~1000. Continues a steady, jagged ascent. Crosses 0.80 around step ~5500 and 0.90 around step ~8000. Ends near 0.91 at step ~10,500.
### Key Observations
1. **Performance Hierarchy:** A clear inverse relationship between initial difficulty and starting accuracy is visible (Level 1 highest, Level 5 lowest).
2. **Convergence:** By the end of training (~10,000 steps), the accuracy gap between the five difficulty levels narrows considerably. Levels 1, 2, and 3 cluster tightly between ~0.96-0.98. Level 4 is very close at ~0.95-0.97. Level 5, while still the lowest, reaches ~0.91.
3. **Volatility:** Lower initial accuracy correlates with higher volatility in the early-to-mid training stages (most pronounced in Level 4, then Level 5). Higher starting levels (1 & 2) are much more stable.
4. **Learning Rate:** Level 5 demonstrates the steepest learning curve, suggesting the model benefits most from extended training on the hardest tasks. Level 1 shows the flattest curve, indicating it was already near peak performance early on.
### Interpretation
This chart likely visualizes the training progression of a machine learning model on a task with graded difficulty. The data suggests several key insights:
* **Task Difficulty is Well-Calibrated:** The clear separation in starting accuracies validates that the defined difficulty levels (1-5) correspond to genuinely harder challenges for the model at the beginning of training.
* **Training is Effective Across All Levels:** The consistent upward trends confirm that the training process successfully improves performance on tasks of all difficulties.
* **The "Easy" Ceiling Effect:** The high and stable performance on Levels 1 and 2 from the outset suggests these tasks may be too easy for the model's initial capacity, leaving little room for improvement (a ceiling effect).
* **The "Hard" Learning Opportunity:** The dramatic improvement on Levels 4 and 5 indicates these tasks contain the most learnable signal. The model's capacity is being fully utilized to master these complex patterns over time.
* **Convergence Implies Mastery:** The narrowing performance gap at the end of training suggests that given sufficient steps, the model can achieve high proficiency even on the hardest tasks, though a small residual gap remains for the most difficult (Level 5). This could indicate either a limit to the model's capacity or that the hardest tasks require even more specialized training.
**In summary, the chart demonstrates a successful training run where a model progressively masters tasks of increasing difficulty, with the most challenging tasks driving the most significant learning gains over time.**
DECODING INTELLIGENCE...