## Line Chart: Model Accuracy vs. Training Steps Across Difficulty Levels
### Overview
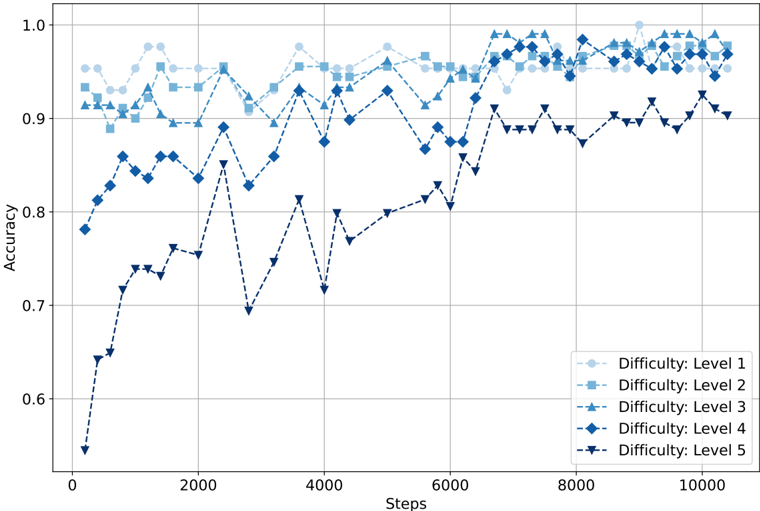
The chart illustrates the convergence of model accuracy across five difficulty levels (1–5) as training progresses over 10,000 steps. Accuracy is plotted on the y-axis (0.5–1.0), while the x-axis represents training steps. Five distinct data series, differentiated by marker shapes and colors, show how models trained on varying difficulty levels perform over time.
### Components/Axes
- **X-axis (Steps)**: Labeled "Steps," ranging from 0 to 10,000 in increments of 2,000.
- **Y-axis (Accuracy)**: Labeled "Accuracy," scaled from 0.5 to 1.0 in increments of 0.1.
- **Legend**: Located in the bottom-right corner, mapping difficulty levels to marker styles and colors:
- **Level 1**: Light blue circles (△)
- **Level 2**: Medium blue squares (■)
- **Level 3**: Dark blue triangles (▲)
- **Level 4**: Dark blue diamonds (◆)
- **Level 5**: Black triangles (▼)
- **Gridlines**: Subtle gridlines at every 0.1 accuracy increment and every 2,000 steps.
### Detailed Analysis
1. **Difficulty Level 1 (Light Blue Circles)**:
- Starts at ~0.92 accuracy at step 0.
- Shows minimal fluctuation, maintaining ~0.92–0.98 accuracy throughout.
- Slight dip to ~0.90 at step 4,000, then stabilizes.
2. **Difficulty Level 2 (Medium Blue Squares)**:
- Begins at ~0.90 accuracy, peaking at ~0.96 by step 2,000.
- Experiences minor oscillations but remains above 0.90.
- Converges with Level 1 by step 8,000.
3. **Difficulty Level 3 (Dark Blue Triangles)**:
- Starts at ~0.85 accuracy, rising to ~0.94 by step 6,000.
- Exhibits sharper fluctuations (e.g., dip to ~0.80 at step 4,000).
- Matches Level 2 accuracy by step 10,000.
4. **Difficulty Level 4 (Dark Blue Diamonds)**:
- Initial accuracy ~0.80, surging to ~0.95 by step 8,000.
- High volatility (e.g., drop to ~0.75 at step 4,000).
- Overtakes Levels 1–3 by step 10,000.
5. **Difficulty Level 5 (Black Triangles)**:
- Begins at ~0.55 accuracy, sharply rising to ~0.90 by step 2,000.
- Sharp dip to ~0.65 at step 4,000, then rapid recovery.
- Reaches ~0.95 by step 10,000, surpassing all other levels.
### Key Observations
- **Convergence**: All difficulty levels converge to ~0.95–0.98 accuracy by step 10,000, suggesting the model generalizes well regardless of initial difficulty.
- **Volatility**: Higher difficulty levels (4–5) exhibit greater short-term fluctuations, likely due to complex data patterns.
- **Initial Disparity**: Level 5 starts at ~0.55 accuracy (vs. Level 1’s ~0.92), highlighting the challenge of training on harder data.
- **Step Dependency**: Accuracy improvements are non-linear, with rapid gains in early steps (e.g., Level 5 jumps from 0.55 to 0.90 in 2,000 steps).
### Interpretation
The chart demonstrates that:
1. **Training Duration Matters**: All models achieve high accuracy (>0.95) by step 10,000, emphasizing the importance of sufficient training steps.
2. **Difficulty Adaptation**: Models trained on harder data (Level 5) initially underperform but catch up, suggesting robust generalization capabilities.
3. **Volatility as a Trade-off**: Higher difficulty training introduces instability but may yield better long-term performance, as seen in Level 4/5 surpassing lower levels.
4. **Early vs. Late-Stage Learning**: Early steps show rapid accuracy gains, while later steps refine performance, indicating diminishing returns after ~6,000 steps.
This analysis aligns with principles of machine learning, where exposure to diverse, complex data improves model robustness, even if initial training is slower.