## Line Chart: Benchmark: OlympiadBench
### Overview
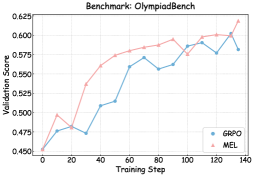
The chart compares the validation scores of two models, **GRPO** (blue) and **MEL** (pink), across training steps (0–140) on the OlympiadBench benchmark. Both lines exhibit upward trends with fluctuations, but **MEL** consistently outperforms **GRPO** until the final step, where **GRPO** surpasses it slightly.
### Components/Axes
- **X-axis**: Training Step (0–140, increments of 20).
- **Y-axis**: Validation Score (0.450–0.625, increments of 0.025).
- **Legend**: Located in the bottom-right corner.
- **GRPO**: Blue line with circular markers.
- **MEL**: Pink line with triangular markers.
### Detailed Analysis
- **GRPO (Blue)**:
- Starts at ~0.45 (step 0).
- Rises to ~0.48 (step 20), dips to ~0.47 (step 40), then climbs to ~0.56 (step 60).
- Peaks at ~0.61 (step 140).
- Notable dip at step 80 (~0.56) and step 100 (~0.58).
- **MEL (Pink)**:
- Starts at ~0.45 (step 0).
- Rises to ~0.53 (step 40), ~0.58 (step 60), ~0.59 (step 80), ~0.60 (step 100), ~0.60 (step 120), and peaks at ~0.625 (step 140).
- Steady upward trend with minor fluctuations.
### Key Observations
1. **MEL** maintains a higher validation score than **GRPO** for most steps (e.g., ~0.58 vs. ~0.56 at step 80).
2. **GRPO** surpasses **MEL** only at the final step (140), with scores ~0.61 vs. ~0.625.
3. Both models show volatility in mid-training (steps 40–80), with **GRPO** experiencing sharper dips.
4. Final scores suggest **GRPO** achieves near-parity with **MEL** by step 140.
### Interpretation
The data demonstrates that **MEL** initially outperforms **GRPO** in validation scores, likely due to architectural or training advantages. However, **GRPO**’s late-stage improvement (step 140) indicates potential for catching up with extended training. The volatility in mid-training suggests challenges in optimization or overfitting for both models. The final crossover at step 140 raises questions about **GRPO**’s scalability or efficiency in later training phases. This benchmark highlights trade-offs between model design and training duration for OlympiadBench performance.