\n
## Line Chart: Validation Score vs. Training Step on OlympiadBench
### Overview
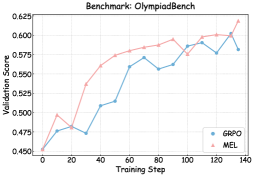
This image presents a line chart illustrating the validation score of two models, GRPO and MEL, as a function of the training step on the OlympiadBench benchmark. The chart displays the performance improvement of both models during training.
### Components/Axes
* **Title:** Benchmark: OlympiadBench (positioned at the top-center)
* **X-axis:** Training Step (ranging from approximately 0 to 140, with tick marks at intervals of 20)
* **Y-axis:** Validation Score (ranging from approximately 0.45 to 0.625, with tick marks at intervals of 0.025)
* **Legend:** Located in the top-right corner.
* GRPO (represented by a light blue line with circular markers)
* MEL (represented by a light red line with triangular markers)
### Detailed Analysis
**GRPO (Light Blue Line):**
The GRPO line generally slopes upward, indicating increasing validation score with training steps.
* At Training Step 0: Validation Score ≈ 0.46
* At Training Step 20: Validation Score ≈ 0.48
* At Training Step 40: Validation Score ≈ 0.52
* At Training Step 60: Validation Score ≈ 0.56
* At Training Step 80: Validation Score ≈ 0.56
* At Training Step 100: Validation Score ≈ 0.56
* At Training Step 120: Validation Score ≈ 0.58
* At Training Step 140: Validation Score ≈ 0.60
**MEL (Light Red Line):**
The MEL line also slopes upward, but with a steeper initial increase and some fluctuations.
* At Training Step 0: Validation Score ≈ 0.45
* At Training Step 20: Validation Score ≈ 0.47
* At Training Step 40: Validation Score ≈ 0.55
* At Training Step 60: Validation Score ≈ 0.59
* At Training Step 80: Validation Score ≈ 0.59
* At Training Step 100: Validation Score ≈ 0.57
* At Training Step 120: Validation Score ≈ 0.59
* At Training Step 140: Validation Score ≈ 0.61
### Key Observations
* MEL consistently outperforms GRPO in terms of validation score across all training steps.
* Both models show diminishing returns in performance improvement as training progresses beyond 80 steps.
* GRPO exhibits a more stable and gradual increase in validation score, while MEL shows more volatility.
* The difference in validation score between the two models is most pronounced in the initial training stages (0-40 steps).
### Interpretation
The chart demonstrates the learning curves of two models (GRPO and MEL) on the OlympiadBench benchmark. MEL appears to be a more effective model, achieving higher validation scores throughout the training process. The initial rapid increase in MEL's performance suggests faster learning or a better initial parameter configuration. The plateauing of both curves towards the end of the training process indicates that further training may not yield significant improvements. The fluctuations in MEL's curve could be due to factors such as the stochastic nature of the training process or the complexity of the OlympiadBench dataset. The consistent upward trend for both models suggests that the training process is generally effective in improving performance on the benchmark. The data suggests that MEL is a better choice for this benchmark, but further investigation might be needed to understand the reasons for its superior performance and the fluctuations in its learning curve.