## Line Chart: Modality Specialization vs. Layers
### Overview
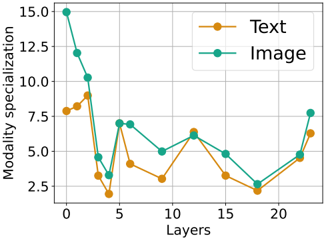
The image is a line chart comparing the modality specialization of "Text" and "Image" across different layers. The x-axis represents the layers, and the y-axis represents modality specialization.
### Components/Axes
* **X-axis:** Layers, ranging from 0 to 22.
* **Y-axis:** Modality specialization, ranging from 2.5 to 15.0.
* **Legend:** Located in the top-right corner.
* **Text:** Represented by an orange line.
* **Image:** Represented by a teal line.
### Detailed Analysis
* **Text (Orange Line):**
* Starts at approximately 8.0 at layer 0.
* Increases slightly to approximately 9.0 at layer 1.
* Decreases sharply to approximately 3.0 at layer 4.
* Increases to approximately 4.0 at layer 7.
* Decreases to approximately 3.0 at layer 11.
* Increases to approximately 6.0 at layer 13.
* Decreases to approximately 3.0 at layer 17.
* Decreases to approximately 2.0 at layer 20.
* Increases to approximately 7.0 at layer 23.
* **Image (Teal Line):**
* Starts at approximately 15.0 at layer 0.
* Decreases to approximately 12.0 at layer 1.
* Decreases to approximately 10.0 at layer 2.
* Decreases sharply to approximately 4.0 at layer 4.
* Increases to approximately 7.0 at layer 5.
* Decreases to approximately 6.0 at layer 10.
* Increases to approximately 6.0 at layer 13.
* Decreases to approximately 5.0 at layer 16.
* Decreases to approximately 2.0 at layer 20.
* Increases to approximately 8.0 at layer 23.
### Key Observations
* The "Image" modality specialization starts much higher than the "Text" modality specialization.
* Both modalities experience a significant drop in specialization around layer 4.
* The "Image" modality specialization generally remains higher than the "Text" modality specialization, except for a brief period around layer 13.
* Both modalities show an increase in specialization towards the end of the layers.
### Interpretation
The chart illustrates how the specialization of text and image modalities changes across different layers of a model. The initial high specialization of the "Image" modality suggests that the early layers are more focused on processing visual information. The subsequent drop in both modalities around layer 4 could indicate a point where the model begins to integrate information from both modalities. The overall trend suggests that the model gradually refines its specialization as it progresses through the layers, with both modalities becoming more specialized towards the end. The fluctuations in specialization may reflect the model's adaptation to different types of input or tasks.