\n
## Line Chart: Modality Specialization vs. Layers
### Overview
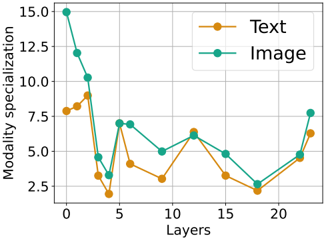
This image presents a line chart illustrating the relationship between the number of layers and modality specialization. Two data series are plotted: one representing "Text" and the other representing "Image". The chart appears to be investigating how specialization changes as the number of layers increases.
### Components/Axes
* **X-axis:** "Layers" - ranging from 0 to 20, with tick marks at intervals of 5.
* **Y-axis:** "Modality specialization" - ranging from 0 to 15, with tick marks at intervals of 2.5.
* **Data Series 1:** "Text" - represented by an orange line with circular markers.
* **Data Series 2:** "Image" - represented by a teal line with circular markers.
* **Legend:** Located in the top-right corner, clearly labeling each data series with its corresponding color.
### Detailed Analysis
**Image Data Series (Teal Line):**
The teal line representing "Image" starts at approximately 15.0 at Layer 0. It then sharply declines to approximately 12.5 at Layer 5, then to approximately 5.0 at Layer 10. It rises to approximately 6.0 at Layer 15, and then declines to approximately 5.0 at Layer 20, before rising to approximately 7.5 at Layer 20.
* Layer 0: ~15.0
* Layer 5: ~12.5
* Layer 10: ~5.0
* Layer 15: ~6.0
* Layer 20: ~7.5
**Text Data Series (Orange Line):**
The orange line representing "Text" starts at approximately 8.0 at Layer 0. It then sharply declines to approximately 2.5 at Layer 5. It rises to approximately 4.0 at Layer 10, then declines to approximately 3.0 at Layer 15, and then rises to approximately 6.0 at Layer 20.
* Layer 0: ~8.0
* Layer 5: ~2.5
* Layer 10: ~4.0
* Layer 15: ~3.0
* Layer 20: ~6.0
### Key Observations
* Both data series exhibit a significant initial decline in modality specialization as the number of layers increases from 0 to 5.
* The "Image" data series generally maintains higher specialization values than the "Text" data series throughout the observed range.
* The "Text" data series shows more fluctuation, with a more pronounced dip at Layer 5 and a more gradual increase towards Layer 20.
* Both lines appear to converge towards the end of the chart, suggesting a potential leveling off of specialization differences at higher layer counts.
### Interpretation
The chart suggests that increasing the number of layers in a model initially leads to a decrease in modality specialization for both text and image processing. This could indicate that early layers are responsible for capturing broad, general features, and as layers are added, the model begins to lose some of its initial specialization. However, the "Image" modality consistently demonstrates higher specialization than "Text," potentially indicating that image processing benefits more from deeper models or that image features are more easily captured and maintained across layers. The convergence of the lines at higher layer counts suggests that beyond a certain point, adding more layers does not significantly differentiate the specialization levels between the two modalities. This could be due to saturation effects or the emergence of shared representations. The initial drop in specialization could also be a result of overfitting or the introduction of noise as the model complexity increases. Further investigation would be needed to determine the underlying mechanisms driving these trends.