## Line Chart: Performance Comparison Across Runs
### Overview
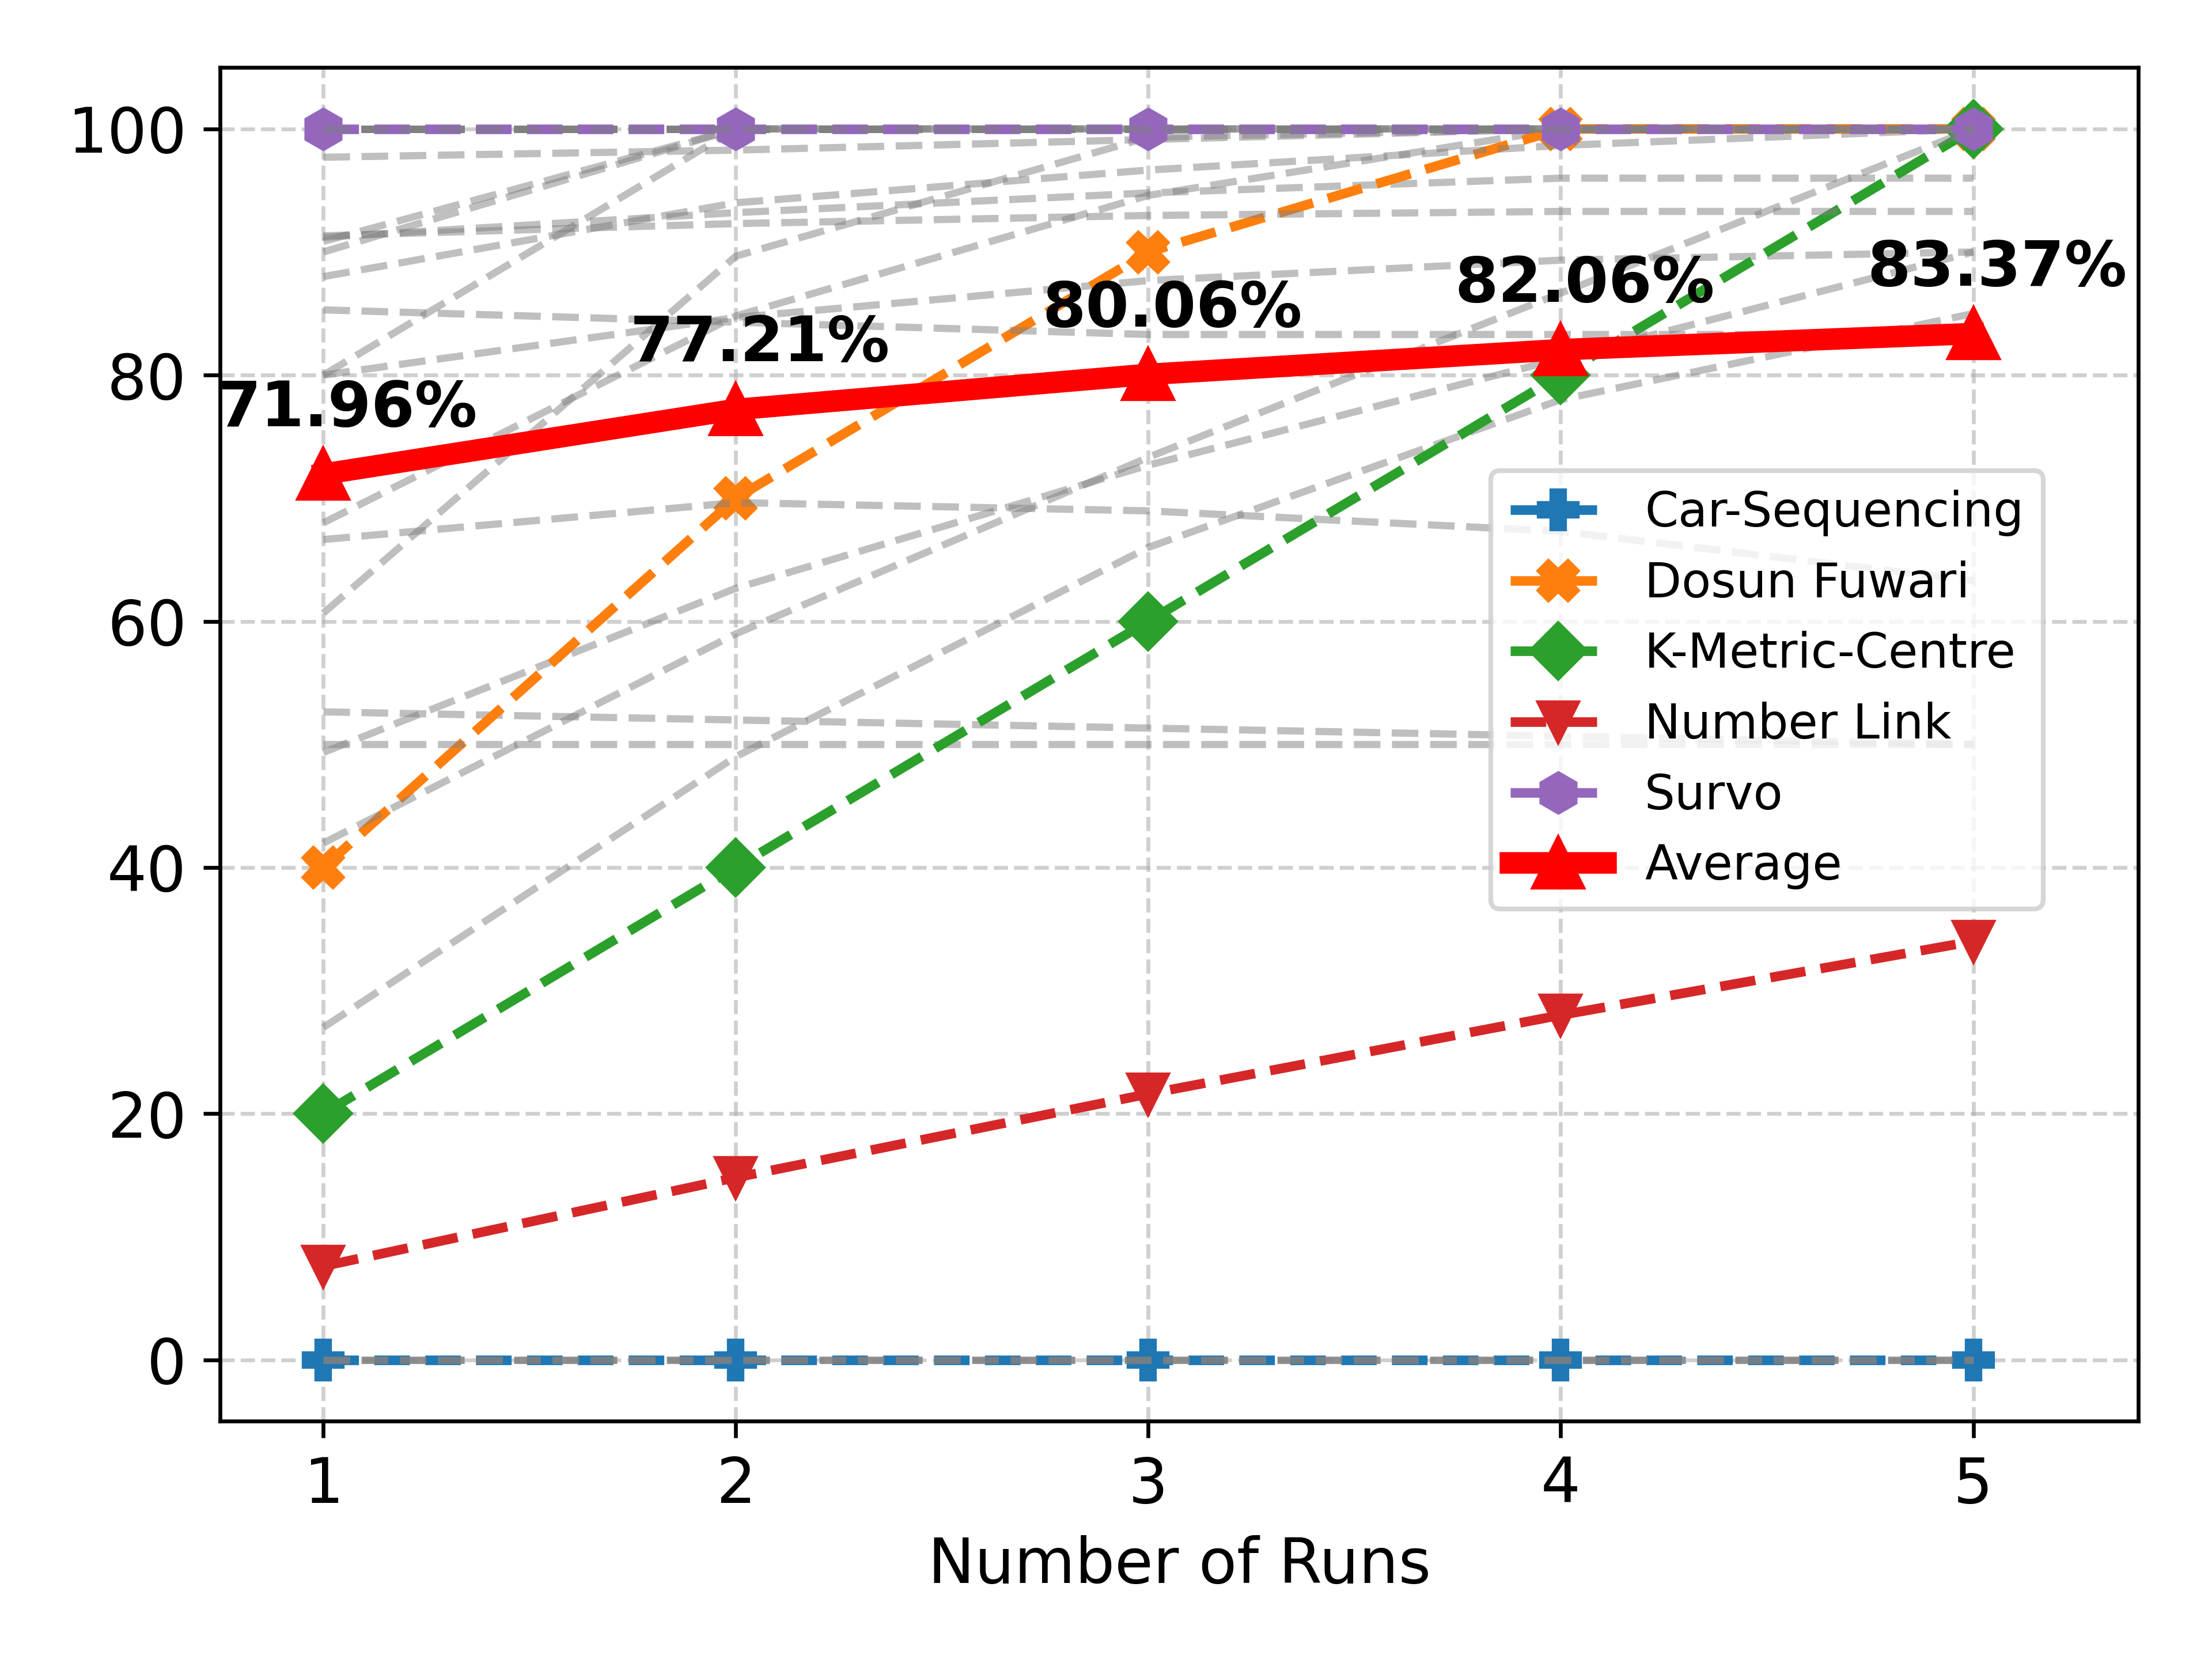
The image is a line chart comparing the performance of five different algorithms (Car-Sequencing, Dosun Fuwari, K-Metric-Centre, Number Link, and Survo) across five runs. It also includes an average performance line. The y-axis represents performance, and the x-axis represents the number of runs.
### Components/Axes
* **X-axis:** Number of Runs (labeled 1 to 5)
* **Y-axis:** Performance (labeled 0 to 100)
* **Legend:** Located on the right side of the chart, associating colors and markers with algorithm names:
* Blue (+): Car-Sequencing
* Orange (x): Dosun Fuwari
* Green (diamond): K-Metric-Centre
* Red (upside-down triangle): Number Link
* Purple (hexagon): Survo
* Red (triangle): Average
* **Grid:** Light gray dashed lines provide a visual grid.
### Detailed Analysis or Content Details
**1. Car-Sequencing (Blue, +):**
* Trend: The line is essentially flat at 0 across all runs.
* Values: Performance remains at approximately 0 for all runs (1 to 5).
**2. Dosun Fuwari (Orange, x):**
* Trend: The line slopes upward.
* Values:
* Run 1: ~40
* Run 2: ~70
* Run 3: ~85
* Run 4: ~95
* Run 5: ~100
**3. K-Metric-Centre (Green, diamond):**
* Trend: The line slopes upward.
* Values:
* Run 1: ~20
* Run 2: ~40
* Run 3: ~60
* Run 4: ~80
* Run 5: ~100
**4. Number Link (Red, upside-down triangle):**
* Trend: The line slopes upward.
* Values:
* Run 1: ~8
* Run 2: ~15
* Run 3: ~23
* Run 4: ~29
* Run 5: ~35
**5. Survo (Purple, hexagon):**
* Trend: The line is essentially flat at 100 across all runs.
* Values: Performance remains at approximately 100 for all runs (1 to 5).
**6. Average (Red, triangle):**
* Trend: The line slopes upward.
* Values:
* Run 1: 71.96%
* Run 2: 77.21%
* Run 3: 80.06%
* Run 4: 82.06%
* Run 5: 83.37%
**Other Lines (Gray, dashed):**
* There are multiple gray dashed lines, but they are not labeled in the legend.
### Key Observations
* Car-Sequencing consistently performs poorly, with a performance of 0 across all runs.
* Survo consistently performs at the maximum, with a performance of 100 across all runs.
* Dosun Fuwari and K-Metric-Centre show significant performance improvements as the number of runs increases.
* Number Link shows a gradual performance improvement as the number of runs increases, but its overall performance is significantly lower than Survo, Dosun Fuwari, and K-Metric-Centre.
* The average performance increases with the number of runs, reflecting the general upward trend of most algorithms.
### Interpretation
The chart illustrates the performance of different algorithms over multiple runs. Survo is the clear winner, achieving perfect performance consistently. Car-Sequencing appears to be ineffective in this context. Dosun Fuwari and K-Metric-Centre show promise with increasing runs. The average performance provides a benchmark, showing the overall trend of improvement as the number of runs increases. The unlabeled gray lines likely represent individual trials or variations within the algorithms, adding to the complexity of the performance landscape.