## Line Chart: Performance Comparison Across Runs
### Overview
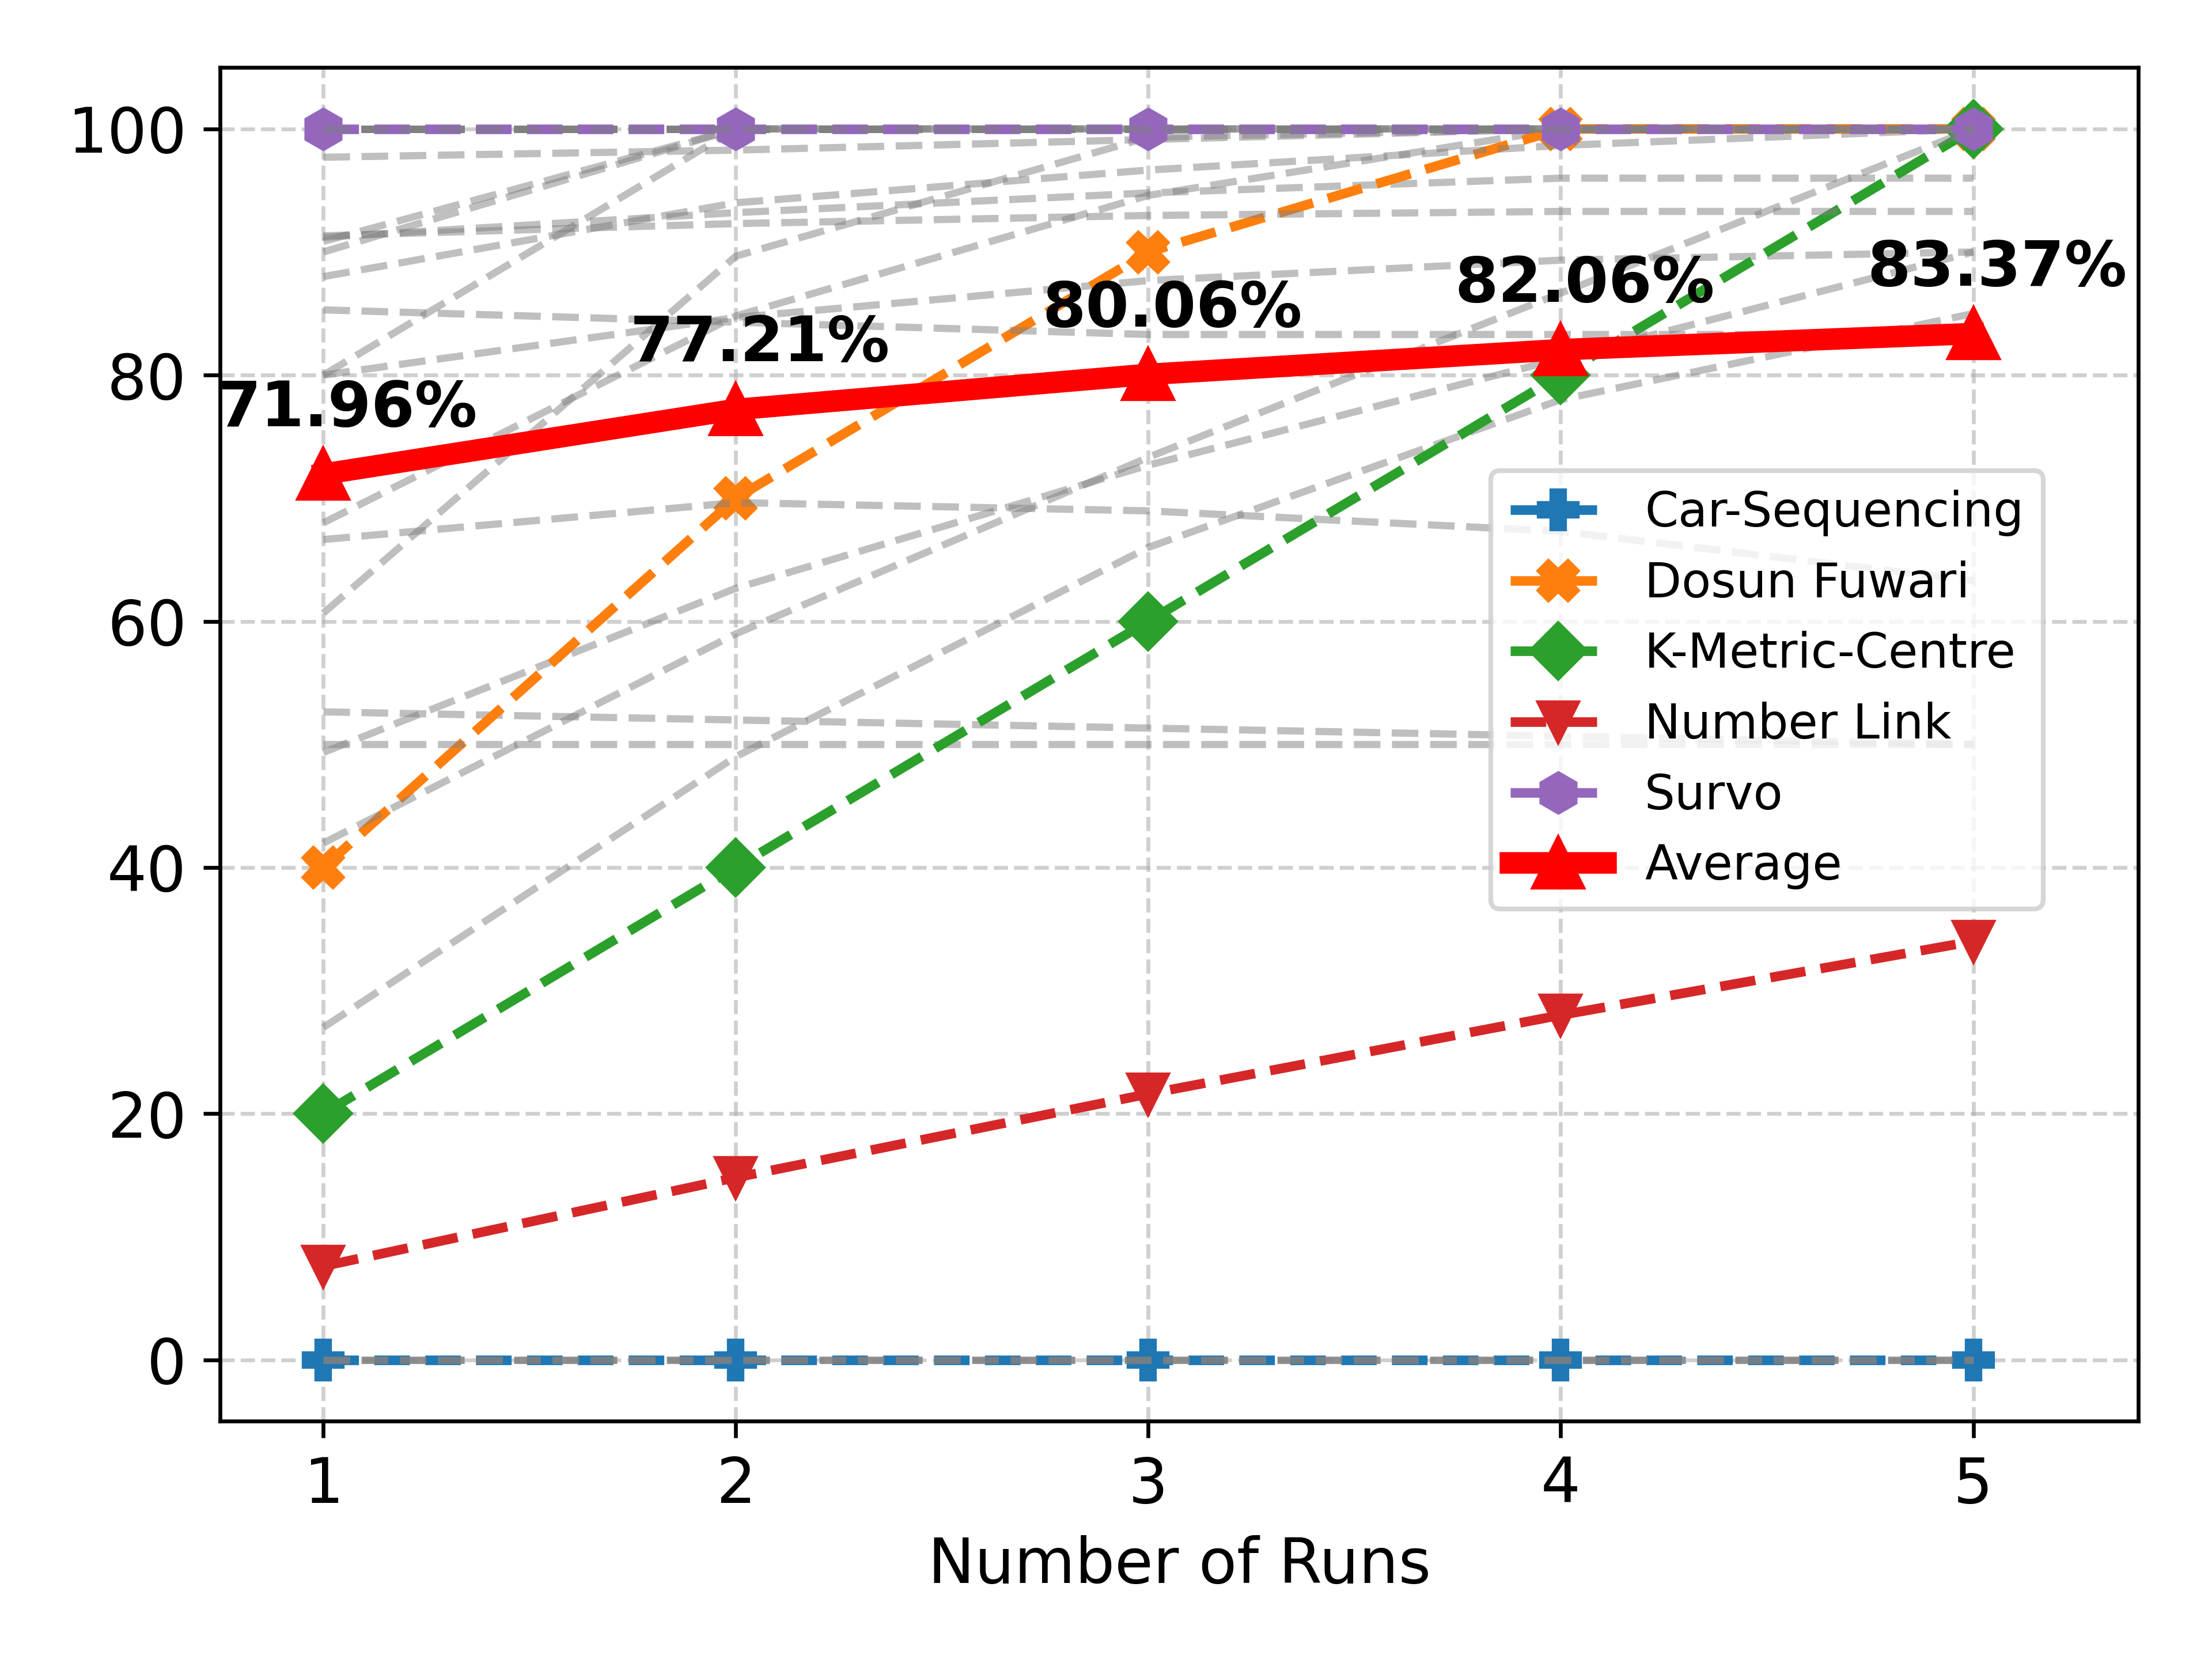
This line chart compares the performance of six different methods (Car-Sequencing, Dosun Fuwari, K-Metric-Centre, Number Link, Survo, and Average) across five runs. The performance is measured in percentage, and the x-axis represents the number of runs. The chart displays the trend of each method's performance as the number of runs increases.
### Components/Axes
* **X-axis:** Number of Runs (1 to 5)
* **Y-axis:** Percentage (Scale from 0 to 100)
* **Legend:** Located in the top-right corner, identifying each line with a unique color and label.
* Car-Sequencing (Blue)
* Dosun Fuwari (Orange)
* K-Metric-Centre (Red)
* Number Link (Grey)
* Survo (Purple)
* Average (Green)
* **Data Markers:** Each line has markers at each data point (run number) to indicate the exact percentage value.
* **Percentage Labels:** Percentage values are displayed at each data point for runs 1, 2, 3, 4, and 5.
### Detailed Analysis
Here's a breakdown of each line's trend and data points:
* **Car-Sequencing (Blue):** The line is relatively flat, indicating minimal performance change with increasing runs.
* Run 1: ~0%
* Run 2: ~5%
* Run 3: ~5%
* Run 4: ~5%
* Run 5: ~8%
* **Dosun Fuwari (Orange):** The line shows a decreasing trend initially, then plateaus.
* Run 1: ~72%
* Run 2: ~77%
* Run 3: ~80%
* Run 4: ~82%
* Run 5: ~83%
* **K-Metric-Centre (Red):** The line exhibits a strong upward trend, indicating significant performance improvement with each run.
* Run 1: ~7%
* Run 2: ~22%
* Run 3: ~43%
* Run 4: ~58%
* Run 5: ~73%
* **Number Link (Grey):** The line is relatively flat, with a slight upward trend.
* Run 1: ~40%
* Run 2: ~50%
* Run 3: ~60%
* Run 4: ~70%
* Run 5: ~80%
* **Survo (Purple):** The line is relatively flat, with a slight upward trend.
* Run 1: ~40%
* Run 2: ~50%
* Run 3: ~60%
* Run 4: ~70%
* Run 5: ~80%
* **Average (Green):** The line shows a consistent upward trend, but less steep than K-Metric-Centre.
* Run 1: ~35%
* Run 2: ~45%
* Run 3: ~60%
* Run 4: ~70%
* Run 5: ~80%
### Key Observations
* K-Metric-Centre demonstrates the most significant improvement in performance with increasing runs.
* Car-Sequencing shows minimal change in performance across all runs.
* Dosun Fuwari shows a steady increase in performance, but plateaus after Run 3.
* Number Link and Survo show similar performance trends.
* The Average line provides a benchmark for comparison.
### Interpretation
The chart suggests that the K-Metric-Centre method benefits significantly from repeated runs, potentially due to iterative refinement or learning. Car-Sequencing appears to be stable but doesn't improve with more runs. Dosun Fuwari shows initial gains but reaches a performance limit. The Average line indicates the overall performance trend across all methods. The data suggests that for tasks where performance is critical, K-Metric-Centre is the most promising method, but it requires multiple runs to achieve optimal results. The similarity between Number Link and Survo suggests they may be based on similar principles or have comparable performance characteristics. The flat line of Car-Sequencing suggests it may be a simpler or less adaptable method. The percentage labels provide a clear indication of the performance level at each run, allowing for a direct comparison between the different methods.