## Line Chart: GCG Attack Loss vs. GCG Step
### Overview
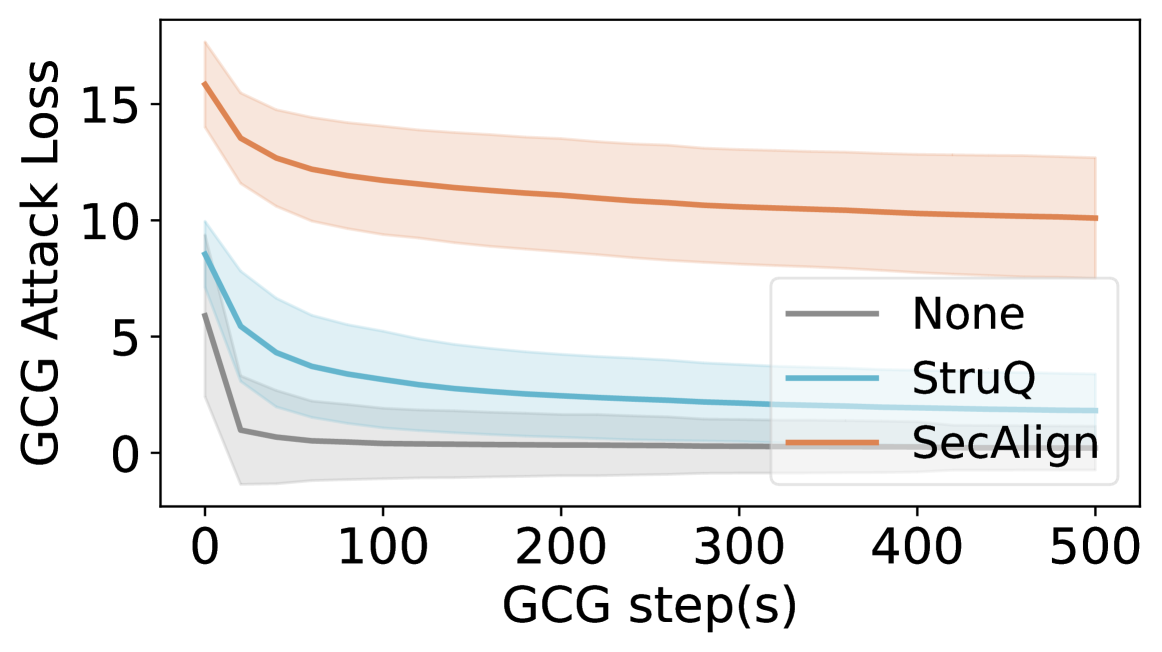
The image is a line chart comparing the GCG (Generative Coordinate Gradients) Attack Loss over GCG steps for three different configurations: "None", "StruQ", and "SecAlign". The chart displays the loss values as a function of the GCG step, with shaded regions indicating the uncertainty or variance around each line.
### Components/Axes
* **X-axis:** GCG step(s), ranging from 0 to 500 in increments of 100.
* **Y-axis:** GCG Attack Loss, ranging from 0 to 15 in increments of 5.
* **Legend:** Located in the center-right of the chart.
* **None:** Represented by a gray line with a light gray shaded region.
* **StruQ:** Represented by a light blue line with a light blue shaded region.
* **SecAlign:** Represented by a light orange line with a light orange shaded region.
### Detailed Analysis
* **None (Gray):** The gray line starts at approximately 1.5 and decreases rapidly to around 0.5 by step 100. It then remains relatively flat, hovering around 0.5 for the rest of the steps.
* **StruQ (Light Blue):** The light blue line starts at approximately 9 and decreases to around 3.5 by step 100. It continues to decrease, but at a slower rate, reaching approximately 2.5 by step 500.
* **SecAlign (Light Orange):** The light orange line starts at approximately 16 and decreases to around 12 by step 100. It continues to decrease, but at a slower rate, reaching approximately 10 by step 500.
### Key Observations
* All three configurations show a decrease in GCG Attack Loss as the GCG step increases.
* The "SecAlign" configuration consistently has the highest GCG Attack Loss across all GCG steps.
* The "None" configuration consistently has the lowest GCG Attack Loss across all GCG steps.
* The "StruQ" configuration falls in between "None" and "SecAlign" in terms of GCG Attack Loss.
* The rate of decrease in GCG Attack Loss diminishes as the GCG step increases for all three configurations.
### Interpretation
The chart suggests that both "StruQ" and "SecAlign" methods increase the GCG Attack Loss compared to the "None" configuration. The "SecAlign" method appears to have a more significant impact on increasing the attack loss than the "StruQ" method. The decreasing trend in attack loss with increasing GCG steps indicates that the models are becoming more robust or resistant to GCG attacks as they are trained or fine-tuned. The shaded regions around each line likely represent the variance or standard deviation of the attack loss across multiple runs or experiments, providing an indication of the stability and reliability of each configuration.