## Line Chart: GCG Attack Loss vs. GCG Steps
### Overview
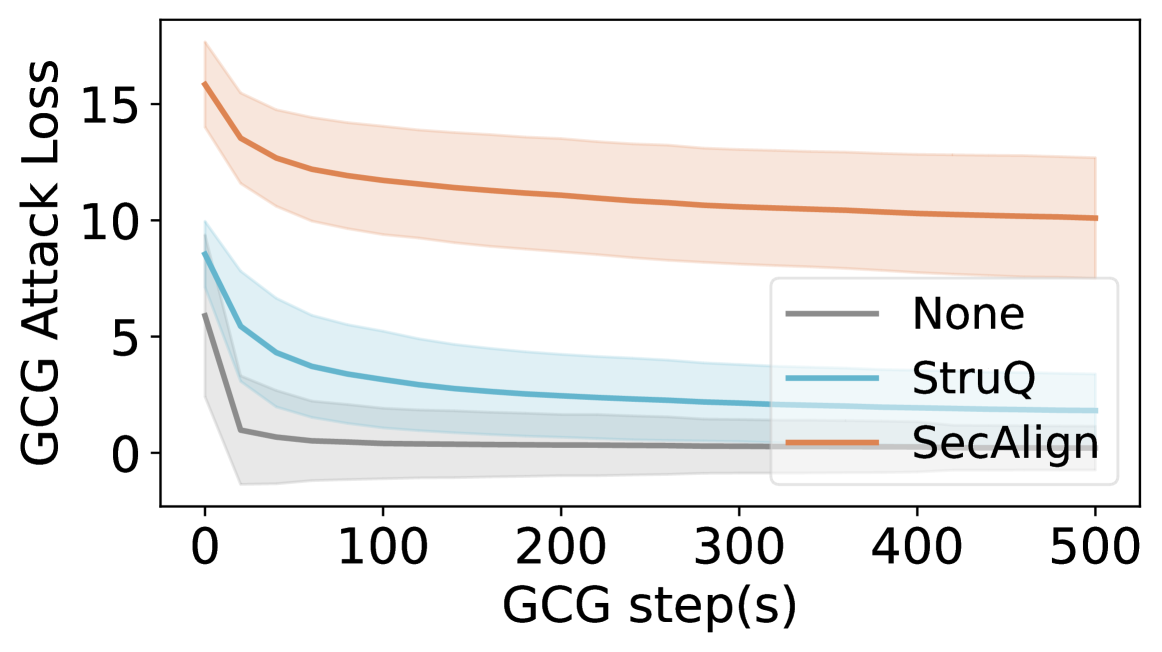
This chart displays the relationship between GCG Attack Loss and GCG steps for three different conditions: None, StruQ, and SecAlign. The chart uses line plots with shaded confidence intervals to represent the data.
### Components/Axes
* **X-axis:** "GCG step(s)", ranging from 0 to 500.
* **Y-axis:** "GCG Attack Loss", ranging from 0 to 16.
* **Legend:** Located in the top-right corner, with the following entries:
* "None" - represented by a gray line.
* "StruQ" - represented by a light blue line.
* "SecAlign" - represented by an orange line.
### Detailed Analysis
The chart shows three lines, each representing a different condition. Each line is accompanied by a shaded region, presumably representing a confidence interval.
* **None (Gray Line):** The line starts at approximately 2.0 GCG Attack Loss at 0 GCG steps. It gradually increases to approximately 3.0 GCG Attack Loss at 500 GCG steps. The shaded region is relatively narrow, indicating a consistent trend.
* **StruQ (Light Blue Line):** The line begins at approximately 4.5 GCG Attack Loss at 0 GCG steps. It increases to approximately 5.5 GCG Attack Loss at 500 GCG steps. The shaded region is wider than the "None" line, suggesting more variability.
* **SecAlign (Orange Line):** This line starts at approximately 12.5 GCG Attack Loss at 0 GCG steps. It increases to approximately 10.0 GCG Attack Loss at 500 GCG steps. The shaded region is the widest of the three, indicating the most variability.
**Approximate Data Points (extracted visually):**
| GCG Steps | None (GCG Attack Loss) | StruQ (GCG Attack Loss) | SecAlign (GCG Attack Loss) |
|---|---|---|---|
| 0 | 2.0 ± 0.5 | 4.5 ± 1.0 | 12.5 ± 2.0 |
| 100 | 2.5 ± 0.6 | 5.0 ± 1.2 | 11.5 ± 2.5 |
| 200 | 2.7 ± 0.6 | 5.2 ± 1.3 | 11.0 ± 2.8 |
| 300 | 2.8 ± 0.6 | 5.3 ± 1.4 | 10.5 ± 3.0 |
| 400 | 2.9 ± 0.6 | 5.4 ± 1.5 | 10.2 ± 3.2 |
| 500 | 3.0 ± 0.6 | 5.5 ± 1.6 | 10.0 ± 3.5 |
### Key Observations
* SecAlign consistently exhibits the highest GCG Attack Loss throughout the entire range of GCG steps.
* The "None" condition has the lowest GCG Attack Loss.
* The confidence intervals for SecAlign are significantly wider than those for "None" and "StruQ", indicating greater uncertainty or variability in the results.
* The StruQ line shows a relatively stable increase in GCG Attack Loss.
* The SecAlign line shows a slight decrease in GCG Attack Loss after an initial increase.
### Interpretation
The chart suggests that SecAlign is the least effective method in mitigating GCG attacks, as it consistently results in the highest attack loss. The "None" condition, representing no mitigation, performs the best. StruQ offers a moderate level of protection, with an attack loss between the "None" and "SecAlign" conditions. The wider confidence intervals for SecAlign suggest that its performance is more sensitive to variations in the experimental setup or data. The slight decrease in SecAlign's loss towards the end of the GCG steps could indicate a potential stabilization or adaptation of the method, but further investigation is needed to confirm this. The data implies that SecAlign may introduce vulnerabilities or complexities that exacerbate the impact of GCG attacks, or that the method requires more steps to become effective.