## Line Graph: GCG Attack Loss vs. GCG Steps
### Overview
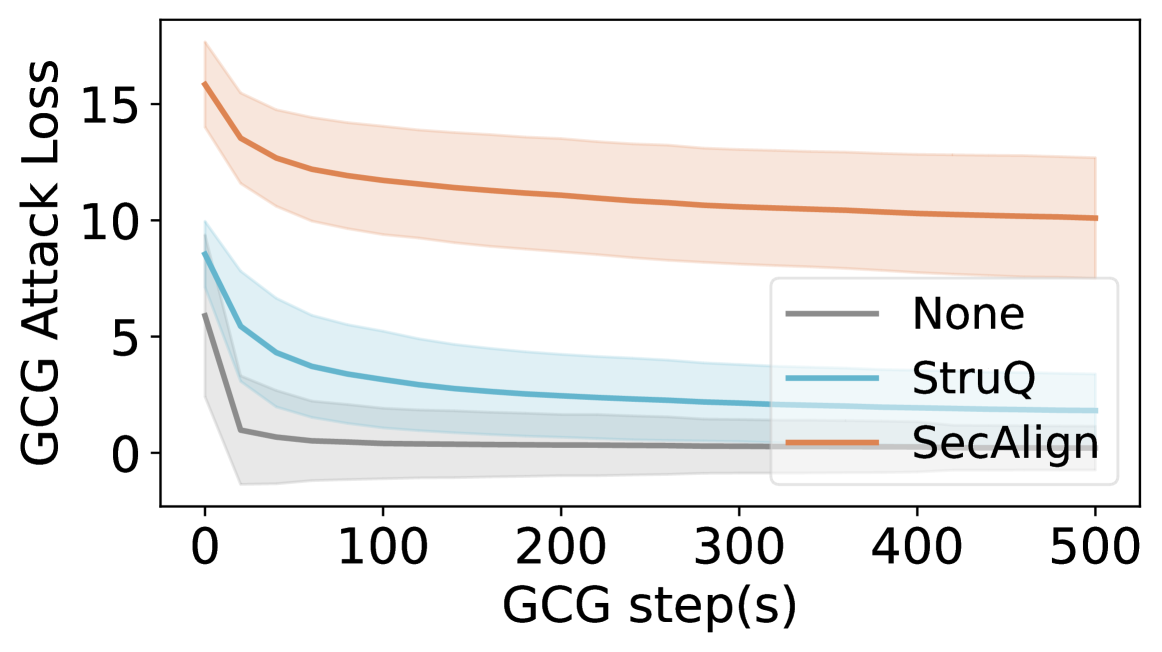
The graph illustrates the relationship between GCG (Gradient-based Confidence Guarantee) steps and GCG Attack Loss for three different methods: "None," "StruQ," and "SecAlign." The y-axis represents attack loss (0–15), while the x-axis represents GCG steps (0–500). Each method is depicted with a colored line and a shaded confidence interval.
### Components/Axes
- **X-axis**: GCG step(s) (0–500, linear scale).
- **Y-axis**: GCG Attack Loss (0–15, linear scale).
- **Legend**:
- Gray: "None" (baseline method).
- Blue: "StruQ" (intermediate method).
- Orange: "SecAlign" (advanced method).
- **Shaded Regions**: Confidence intervals or error margins around each line.
### Detailed Analysis
1. **"None" (Gray Line)**:
- Starts at ~5 attack loss at step 0.
- Drops sharply to ~1 by step 100.
- Remains flat at ~1 for steps 100–500.
- Shaded region narrows significantly after step 100.
2. **"StruQ" (Blue Line)**:
- Starts at ~8 attack loss at step 0.
- Decreases to ~3 by step 100.
- Plateaus at ~3 for steps 100–500.
- Shaded region narrows moderately over time.
3. **"SecAlign" (Orange Line)**:
- Starts at ~15 attack loss at step 0.
- Drops to ~10 by step 100.
- Remains flat at ~10 for steps 100–500.
- Shaded region narrows slightly but stays wider than "StruQ."
### Key Observations
- All methods show a sharp decline in attack loss within the first 100 steps.
- "SecAlign" has the highest initial loss but the largest absolute reduction (~5 units).
- "None" achieves the lowest final attack loss (~1) but starts from a mid-range value.
- Confidence intervals (shaded regions) are widest at step 0 and narrow as steps increase, indicating stabilizing performance.
### Interpretation
The data suggests that both "StruQ" and "SecAlign" methods significantly reduce GCG attack loss compared to the baseline ("None"). However, "SecAlign" exhibits a higher initial vulnerability but achieves a more aggressive reduction in loss, potentially indicating a trade-off between robustness and initial performance. The narrowing shaded regions imply that model performance stabilizes after ~100 steps, with diminishing returns on further optimization. This could reflect a convergence toward optimal attack resistance in gradient-based training frameworks.