## Chart: Eigenvalues Distribution of Keys for Mistral-7B-instruct-v0.2
### Overview
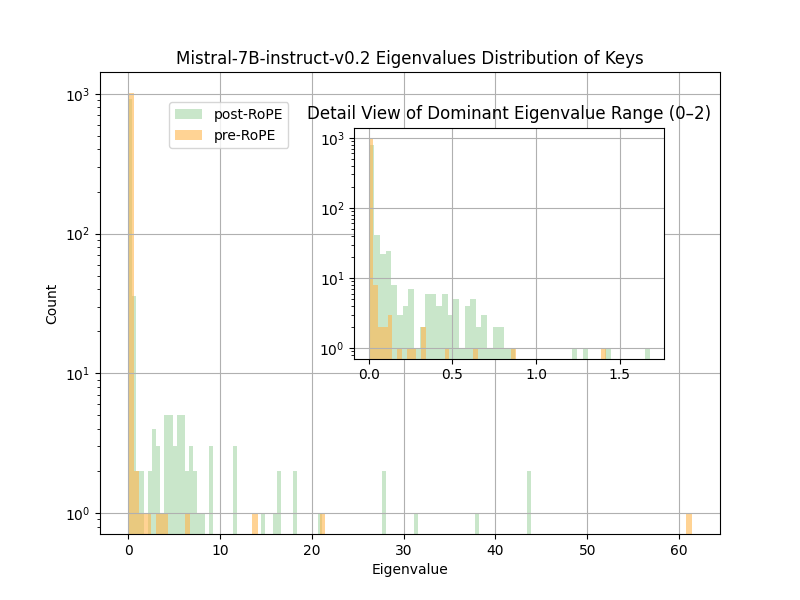
The chart compares the distribution of eigenvalues for keys in the Mistral-7B-instruct-v0.2 model before and after applying RoPE (Rotary Positional Encoding). Two histograms are overlaid: "post-RoPE" (green) and "pre-RoPE" (orange). A secondary inset chart provides a zoomed-in view of the dominant eigenvalue range (0–2).
---
### Components/Axes
- **X-axis (Eigenvalue)**: Linear scale from 0 to 60, with gridlines at integer intervals.
- **Y-axis (Count)**: Logarithmic scale from 10⁰ to 10³, with gridlines at 10¹, 10², and 10³.
- **Legend**: Located in the top-right corner, with green representing "post-RoPE" and orange representing "pre-RoPE."
- **Inset Chart**: Positioned in the top-right corner of the main chart, focusing on eigenvalues 0–2 with the same logarithmic y-axis.
---
### Detailed Analysis
#### Main Chart
- **pre-RoPE (orange)**:
- Dominates at eigenvalue 0, with a count exceeding 10³.
- Sharp decline after eigenvalue 0, with minimal counts beyond eigenvalue 10.
- A secondary peak near eigenvalue 10 (~10¹ count).
- **post-RoPE (green)**:
- Lower counts at eigenvalue 0 (~10¹) compared to pre-RoPE.
- More evenly distributed across eigenvalues 0–20, with counts decreasing gradually.
- Sparse counts beyond eigenvalue 20, with isolated peaks at ~30, 40, and 60.
#### Inset Chart (0–2 Eigenvalue Range)
- **pre-RoPE (orange)**:
- Peaks at eigenvalue 0 (~10² count).
- Gradual decline to ~10¹ at eigenvalue 1.0.
- **post-RoPE (green)**:
- Higher counts than pre-RoPE across the range.
- Peaks at eigenvalue 0.5 (~10¹ count) and 1.0 (~10² count).
- Slightly higher counts at eigenvalue 1.5 (~10¹ count) compared to pre-RoPE.
---
### Key Observations
1. **pre-RoPE** exhibits a highly concentrated distribution, with over 90% of counts clustered near eigenvalue 0.
2. **post-RoPE** shows a more dispersed distribution, with counts spread across eigenvalues 0–20 and isolated peaks at higher eigenvalues.
3. In the dominant range (0–2), post-RoPE consistently outperforms pre-RoPE in count density, particularly at eigenvalues 0.5 and 1.0.
4. The logarithmic y-axis emphasizes the disparity in counts at lower eigenvalues, where pre-RoPE dominates.
---
### Interpretation
The data suggests that applying RoPE significantly alters the eigenvalue distribution of keys in the Mistral-7B-instruct-v0.2 model:
- **pre-RoPE** eigenvalues are tightly concentrated near 0, indicating a lack of positional diversity in key representations.
- **post-RoPE** eigenvalues are more evenly distributed, implying improved positional encoding and potentially better handling of sequence order in the model's attention mechanism.
- The inset confirms that RoPE enhances the model's ability to distinguish between different positional relationships in the dominant eigenvalue range, which is critical for tasks requiring fine-grained context awareness.
This distribution shift highlights RoPE's role in regularizing key representations, likely contributing to the model's improved performance on tasks involving long-range dependencies.