\n
## Scatter Plots: Top 10 Safety Heads Performance
### Overview
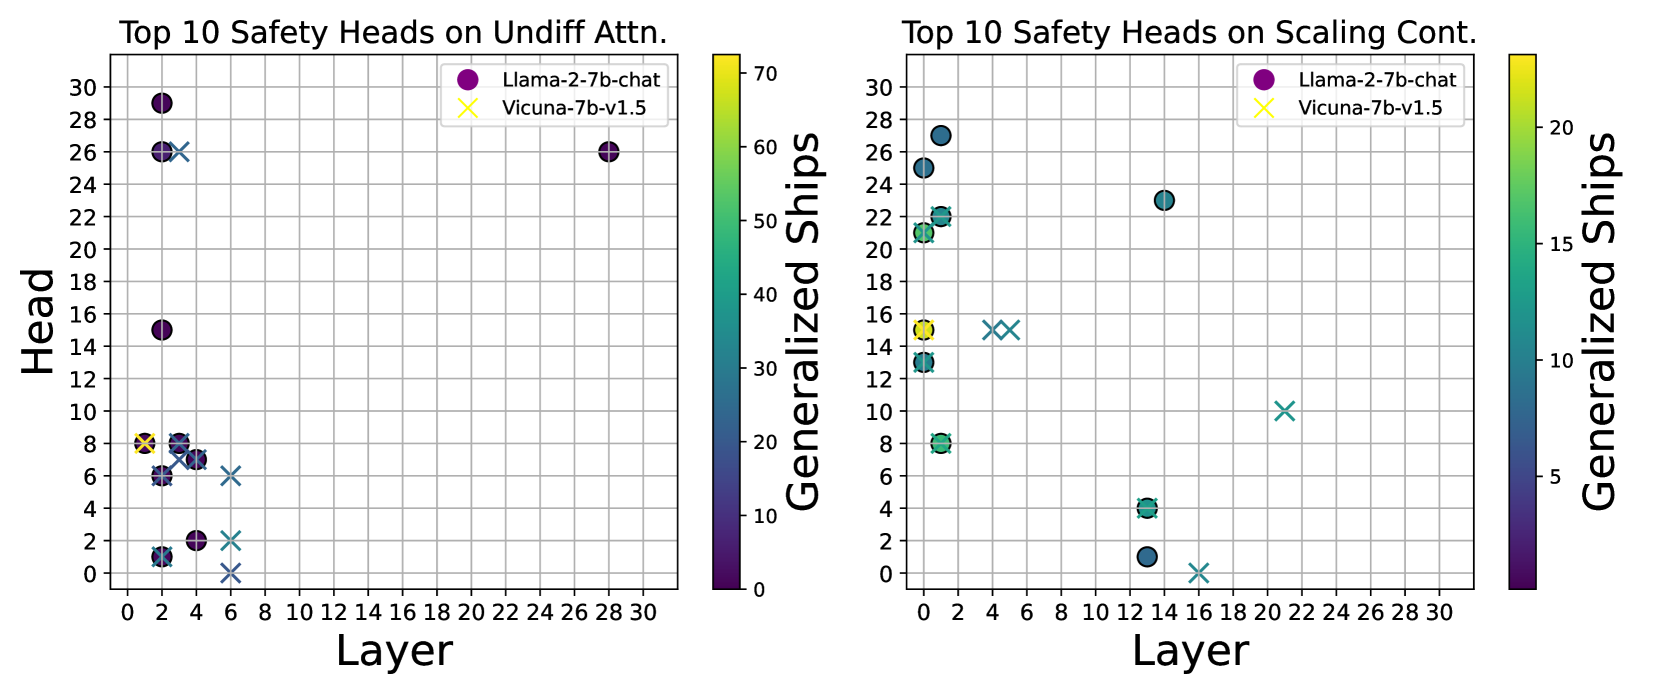
The image presents two scatter plots comparing the performance of "Llama-2-7b-chat" and "Vicuna-7b-v1.5" models across different layers. The plots visualize the relationship between "Layer" (x-axis) and "Generalized Ships" (y-axis) for the top 10 safety heads. The first plot focuses on "Undiff Attn." while the second focuses on "Scaling Cont." The color of the data points corresponds to the model being evaluated, as indicated by the legends. Both plots utilize a color gradient to represent the "Generalized Ships" value.
### Components/Axes
* **X-axis (Both Plots):** "Layer" - Ranging from 0 to 30, with markers at integer values.
* **Y-axis (Both Plots):** "Generalized Ships" - Ranging from 0 to 70 (left plot) and 0 to 20 (right plot).
* **Legend (Both Plots):**
* Purple Circle: "Llama-2-7b-chat"
* Orange Cross: "Vicuna-7b-v1.5"
* **Color Scale (Both Plots):** A gradient from dark blue (low values) to yellow/green (high values) representing "Generalized Ships".
* **Title (Left Plot):** "Top 10 Safety Heads on Undiff Attn."
* **Title (Right Plot):** "Top 10 Safety Heads on Scaling Cont."
### Detailed Analysis or Content Details
**Left Plot: Top 10 Safety Heads on Undiff Attn.**
The plot shows a scattered distribution of points for both models.
* **Llama-2-7b-chat (Purple):**
* Trend: Generally clusters between layers 0-24, with a few points extending to layer 30. The values appear to be relatively stable across layers, with some fluctuations.
* Data Points (Approximate):
* Layer 0: ~28, Generalized Ships ~68
* Layer 2: ~16, Generalized Ships ~55
* Layer 4: ~4, Generalized Ships ~30
* Layer 6: ~2, Generalized Ships ~20
* Layer 8: ~2, Generalized Ships ~20
* Layer 10: ~16, Generalized Ships ~55
* Layer 12: ~24, Generalized Ships ~60
* Layer 16: ~24, Generalized Ships ~60
* Layer 20: ~24, Generalized Ships ~60
* Layer 24: ~28, Generalized Ships ~68
* Layer 30: ~28, Generalized Ships ~68
* **Vicuna-7b-v1.5 (Orange):**
* Trend: Points are more dispersed, with a concentration around layers 0-8.
* Data Points (Approximate):
* Layer 0: ~6, Generalized Ships ~40
* Layer 2: ~6, Generalized Ships ~40
* Layer 4: ~8, Generalized Ships ~45
* Layer 6: ~2, Generalized Ships ~20
* Layer 8: ~2, Generalized Ships ~20
* Layer 10: ~14, Generalized Ships ~45
* Layer 12: ~14, Generalized Ships ~45
* Layer 16: ~10, Generalized Ships ~35
* Layer 20: ~12, Generalized Ships ~40
* Layer 24: ~4, Generalized Ships ~30
**Right Plot: Top 10 Safety Heads on Scaling Cont.**
This plot also shows scattered data points for both models.
* **Llama-2-7b-chat (Purple):**
* Trend: Points are clustered between layers 0-24, with a slight downward trend as the layer number increases.
* Data Points (Approximate):
* Layer 0: ~24, Generalized Ships ~18
* Layer 2: ~24, Generalized Ships ~18
* Layer 4: ~22, Generalized Ships ~16
* Layer 6: ~12, Generalized Ships ~8
* Layer 8: ~6, Generalized Ships ~4
* Layer 10: ~12, Generalized Ships ~8
* Layer 12: ~22, Generalized Ships ~16
* Layer 16: ~20, Generalized Ships ~14
* Layer 20: ~6, Generalized Ships ~4
* Layer 24: ~24, Generalized Ships ~18
* **Vicuna-7b-v1.5 (Orange):**
* Trend: Points are more spread out, with a noticeable concentration around layers 0-16.
* Data Points (Approximate):
* Layer 0: ~16, Generalized Ships ~12
* Layer 2: ~16, Generalized Ships ~12
* Layer 4: ~14, Generalized Ships ~10
* Layer 6: ~10, Generalized Ships ~6
* Layer 8: ~10, Generalized Ships ~6
* Layer 10: ~16, Generalized Ships ~12
* Layer 12: ~16, Generalized Ships ~12
* Layer 16: ~12, Generalized Ships ~8
* Layer 20: ~12, Generalized Ships ~8
* Layer 24: ~4, Generalized Ships ~2
### Key Observations
* In the "Undiff Attn." plot, Llama-2-7b-chat generally exhibits higher "Generalized Ships" values than Vicuna-7b-v1.5 across most layers.
* In the "Scaling Cont." plot, the difference in "Generalized Ships" values between the two models is less pronounced, but Llama-2-7b-chat still tends to perform better.
* Both models show some variability in "Generalized Ships" values across different layers, suggesting that performance is not consistent.
* The color gradients effectively highlight the relative performance of each model at each layer.
### Interpretation
These plots compare the safety performance of two language models, Llama-2-7b-chat and Vicuna-7b-v1.5, across different layers of their architecture. "Generalized Ships" likely represents a metric related to the model's ability to avoid generating unsafe or harmful content. The two plots explore this metric under different conditions: "Undiff Attn." and "Scaling Cont."
The consistent higher performance of Llama-2-7b-chat in both scenarios suggests that it is generally more robust to generating unsafe content than Vicuna-7b-v1.5. The variability in performance across layers indicates that certain layers may be more critical for safety than others. The "Scaling Cont." plot shows a more pronounced decrease in performance for both models as the layer number increases, potentially indicating that safety mechanisms become less effective at deeper layers.
The data suggests that layer-specific optimization or targeted safety interventions could be beneficial for improving the overall safety of these models. Further investigation is needed to understand the underlying reasons for the observed performance differences and to identify the specific layers that contribute most to safety.