## Line Chart: Normalized Latency vs. g
### Overview
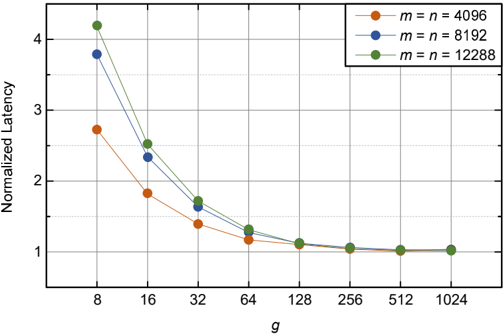
The chart illustrates the relationship between normalized latency and the variable `g` for three distinct system configurations defined by `m = n` values (4096, 8192, 12288). All three data series exhibit a decreasing trend in normalized latency as `g` increases, with convergence observed at higher `g` values.
### Components/Axes
- **Y-Axis**: Normalized Latency (scale: 1 to 4, linear increments of 1).
- **X-Axis**: `g` (values: 8, 16, 32, 64, 128, 256, 512, 1024).
- **Legend**:
- Orange: `m = n = 4096`
- Blue: `m = n = 8192`
- Green: `m = n = 12288`
- **Legend Placement**: Top-right corner of the chart.
### Detailed Analysis
1. **Orange Series (`m = n = 4096`)**:
- Starts at ~2.8 (g=8) and decreases sharply to ~1.0 by g=1024.
- Steepest initial decline among all series.
- Data points: (8, 2.8), (16, 1.8), (32, 1.4), (64, 1.2), (128, 1.1), (256, 1.05), (512, 1.02), (1024, 1.0).
2. **Blue Series (`m = n = 8192`)**:
- Begins at ~3.8 (g=8) and declines gradually to ~1.0 by g=1024.
- Intermediate rate of decrease compared to orange and green.
- Data points: (8, 3.8), (16, 2.3), (32, 1.7), (64, 1.3), (128, 1.15), (256, 1.08), (512, 1.03), (1024, 1.0).
3. **Green Series (`m = n = 12288`)**:
- Highest initial latency (~4.2 at g=8) but converges to ~1.0 by g=1024.
- Slowest rate of decline, maintaining higher latency longer than other series.
- Data points: (8, 4.2), (16, 2.5), (32, 1.9), (64, 1.4), (128, 1.2), (256, 1.1), (512, 1.05), (1024, 1.0).
### Key Observations
- **Convergence**: All three series converge to ~1.0 normalized latency at `g = 1024`, suggesting diminishing returns in latency reduction beyond this point.
- **Initial Disparity**: Larger `m = n` values (green > blue > orange) start with higher latency but follow similar trajectories at higher `g`.
- **Rate of Decline**: Orange series (`m = n = 4096`) exhibits the fastest initial reduction in latency, while green (`m = n = 12288`) decreases most slowly.
### Interpretation
The chart demonstrates that normalized latency decreases with increasing `g` across all configurations. Larger `m = n` values (e.g., 12288) exhibit higher baseline latency but show diminishing sensitivity to `g` compared to smaller configurations. This implies that system performance (latency) is more strongly influenced by `g` than by `m = n` once `g` exceeds ~128. The convergence at `g = 1024` suggests that system optimization efforts targeting `g` may yield uniform benefits regardless of `m = n` scale, though larger configurations require higher initial resource allocation to achieve baseline performance.