## Box Plot: PPL Score Comparison Across Methods
### Overview
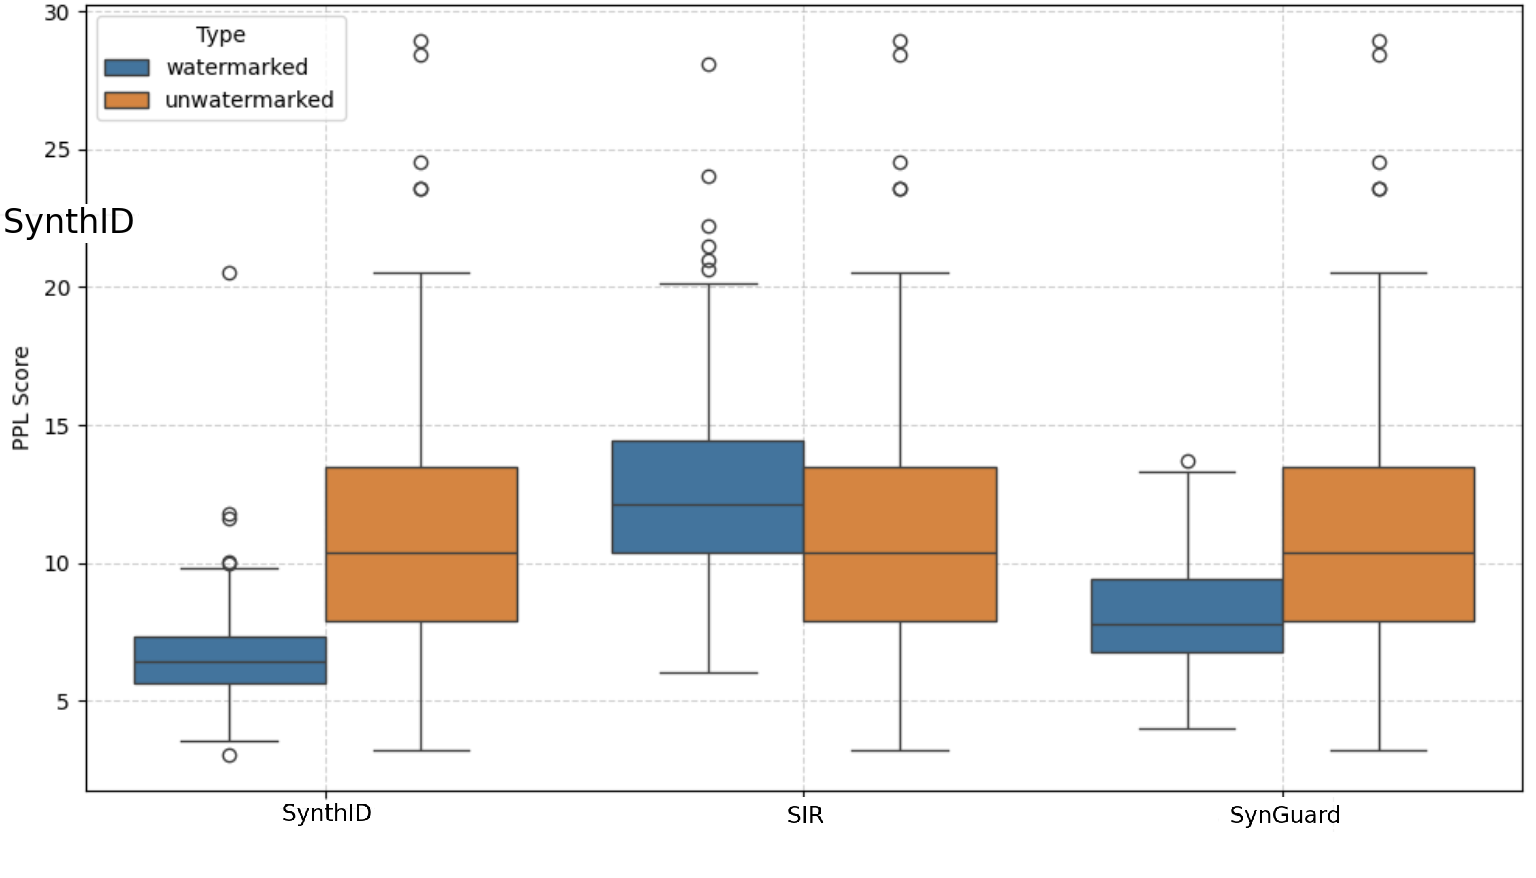
The image presents a comparative box plot analysis of PPL (Perplexity) scores for three text generation methods: SynthID, SIR, and SynGuard. The data is categorized by two types: watermarked (blue) and unwatermarked (orange). The y-axis represents PPL scores (0–30), while the x-axis lists the three methods. Outliers are marked as individual points beyond the whiskers.
### Components/Axes
- **X-axis (Methods)**:
- SynthID (leftmost)
- SIR (middle)
- SynGuard (rightmost)
- **Y-axis (PPL Score)**:
- Range: 0 to 30 (discrete increments of 5)
- Labels: "PPL Score" with numerical ticks at 0, 5, 10, 15, 20, 25, 30
- **Legend**:
- Top-left corner
- Blue = watermarked
- Orange = unwatermarked
- **Outliers**:
- Represented as open circles beyond whiskers
### Detailed Analysis
#### SynthID
- **Watermarked (blue)**:
- Median: ~6
- IQR: 5–7
- Outliers: 10, 11
- **Unwatermarked (orange)**:
- Median: ~10
- IQR: 8–12
- Outliers: 13, 14
#### SIR
- **Watermarked (blue)**:
- Median: ~12
- IQR: 10–14
- Outliers: 15, 16, 17, 18, 19, 20, 21, 22, 23, 24, 25
- **Unwatermarked (orange)**:
- Median: ~10
- IQR: 8–12
- Outliers: 13, 14, 15, 16, 17, 18, 19, 20, 21, 22, 23, 24, 25
#### SynGuard
- **Watermarked (blue)**:
- Median: ~8
- IQR: 6–10
- Outliers: 11, 12
- **Unwatermarked (orange)**:
- Median: ~12
- IQR: 10–14
- Outliers: 15, 16, 17, 18, 19, 20, 21, 22, 23, 24, 25
### Key Observations
1. **Watermarked vs. Unwatermarked**:
- Watermarked methods consistently show lower median PPL scores (better performance) across all three methods.
- SIR’s watermarked median (~12) is higher than SynthID’s (~6) and SynGuard’s (~8), suggesting SIR’s watermarked outputs are less optimal.
- Unwatermarked scores are higher (worse performance) for all methods, with SynGuard’s unwatermarked median (~12) being the highest.
2. **Outliers**:
- SIR’s watermarked data has the most outliers (15–25), indicating significant variability or anomalies.
- SynGuard’s unwatermarked data also has multiple outliers (15–25), suggesting instability in unwatermarked outputs.
3. **Distribution**:
- SynthID’s watermarked data is tightly clustered (IQR: 5–7), while its unwatermarked data is more spread out (IQR: 8–12).
- SIR’s watermarked data has a wider IQR (10–14) compared to its unwatermarked counterpart (8–12).
### Interpretation
The data suggests that **watermarking improves PPL scores** (i.e., reduces perplexity) across all methods, with SynthID showing the most consistent performance for watermarked outputs. SIR’s watermarked data, while having a higher median than SynthID and SynGuard, exhibits extreme variability (outliers up to 25), which may indicate instability or edge cases in its watermarked outputs. SynGuard’s unwatermarked data has the highest median (~12), suggesting it performs worst among unwatermarked methods. The presence of outliers in SIR and SynGuard’s data highlights potential inconsistencies in their respective methods. This analysis underscores the importance of watermarking for optimizing text generation quality, with SynthID emerging as the most reliable method for watermarked outputs.