## Box Plot: PPL Score Comparison of Watermarked vs. Unwatermarked Data
### Overview
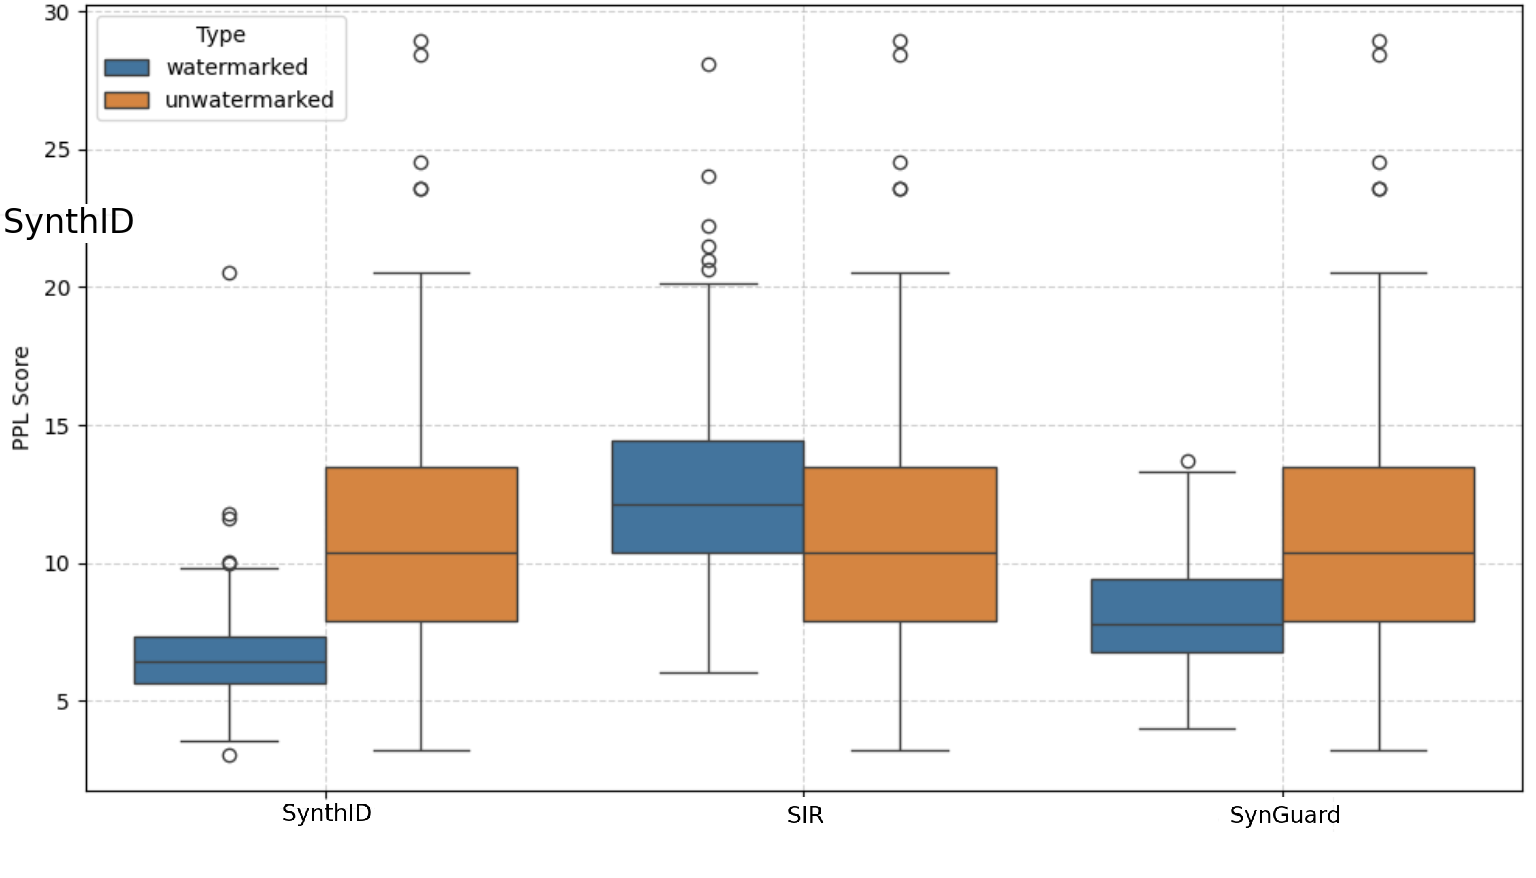
The image is a box plot comparing the PPL (Perplexity) scores of watermarked and unwatermarked data across three different methods: SynthID, SIR, and SynGuard. The plot visualizes the distribution of PPL scores for each method and condition (watermarked/unwatermarked), highlighting the median, quartiles, and outliers.
### Components/Axes
* **Title:** Implicitly, the plot compares PPL scores across different methods and watermark status.
* **X-axis:** Categorical axis representing the methods: SynthID, SIR, and SynGuard.
* **Y-axis:** Numerical axis labeled "PPL Score," ranging from 0 to 30, with tick marks at intervals of 5.
* **Legend:** Located in the top-left corner, indicating the color-coding for "watermarked" (blue) and "unwatermarked" (orange).
* **Box Plot Elements:** Each box plot displays the median (line within the box), the first and third quartiles (edges of the box), and the whiskers extending to the most extreme data points within 1.5 times the interquartile range. Outliers are represented as individual circles.
### Detailed Analysis
**1. SynthID:**
* **Watermarked (Blue):** The box extends from approximately 5.5 to 7.5, with a median around 6.5. The lower whisker extends to approximately 3, and the upper whisker extends to approximately 10. There are two outliers at approximately 12 and 20.5.
* **Unwatermarked (Orange):** The box extends from approximately 8 to 13.5, with a median around 10. The lower whisker extends to approximately 3, and the upper whisker extends to approximately 20.5. There are several outliers, including one at approximately 24 and one at approximately 28.
**2. SIR:**
* **Watermarked (Blue):** The box extends from approximately 10.5 to 14.5, with a median around 13. The lower whisker extends to approximately 6, and the upper whisker extends to approximately 20. There are several outliers, including one at approximately 24 and one at approximately 28.
* **Unwatermarked (Orange):** The box extends from approximately 8 to 12, with a median around 10. The lower whisker extends to approximately 3, and the upper whisker extends to approximately 20.5. There are several outliers, including one at approximately 24 and one at approximately 28.
**3. SynGuard:**
* **Watermarked (Blue):** The box extends from approximately 7 to 9, with a median around 8. The lower whisker extends to approximately 4, and the upper whisker extends to approximately 13.5. There is one outlier at approximately 13.5.
* **Unwatermarked (Orange):** The box extends from approximately 8 to 13.5, with a median around 10. The lower whisker extends to approximately 3, and the upper whisker extends to approximately 20.5. There are several outliers, including one at approximately 24 and one at approximately 28.
### Key Observations
* For SynthID, the watermarked data has a noticeably lower PPL score distribution compared to the unwatermarked data.
* For SIR, the watermarked data has a slightly higher PPL score distribution compared to the unwatermarked data.
* For SynGuard, the watermarked data has a noticeably lower PPL score distribution compared to the unwatermarked data.
* All three methods exhibit outliers in both watermarked and unwatermarked conditions, indicating some data points with significantly higher PPL scores.
* The range of PPL scores is generally higher for unwatermarked data across all three methods.
### Interpretation
The box plot suggests that the presence of a watermark can influence the PPL score, and the direction and magnitude of this influence vary depending on the method used. SynthID and SynGuard appear to result in lower PPL scores for watermarked data, potentially indicating that the watermark improves the model's perplexity or predictability. Conversely, SIR shows a slight increase in PPL score for watermarked data. The presence of outliers suggests that there are instances where the watermark has a more pronounced effect on the PPL score. The higher range of PPL scores for unwatermarked data might indicate greater variability or uncertainty in the model's predictions without the watermark. Further investigation would be needed to understand the specific mechanisms by which each method interacts with the watermark and affects the PPL score.