# Technical Document Extraction: Scatter Plot Analysis
## 1. **Axis Labels and Markers**
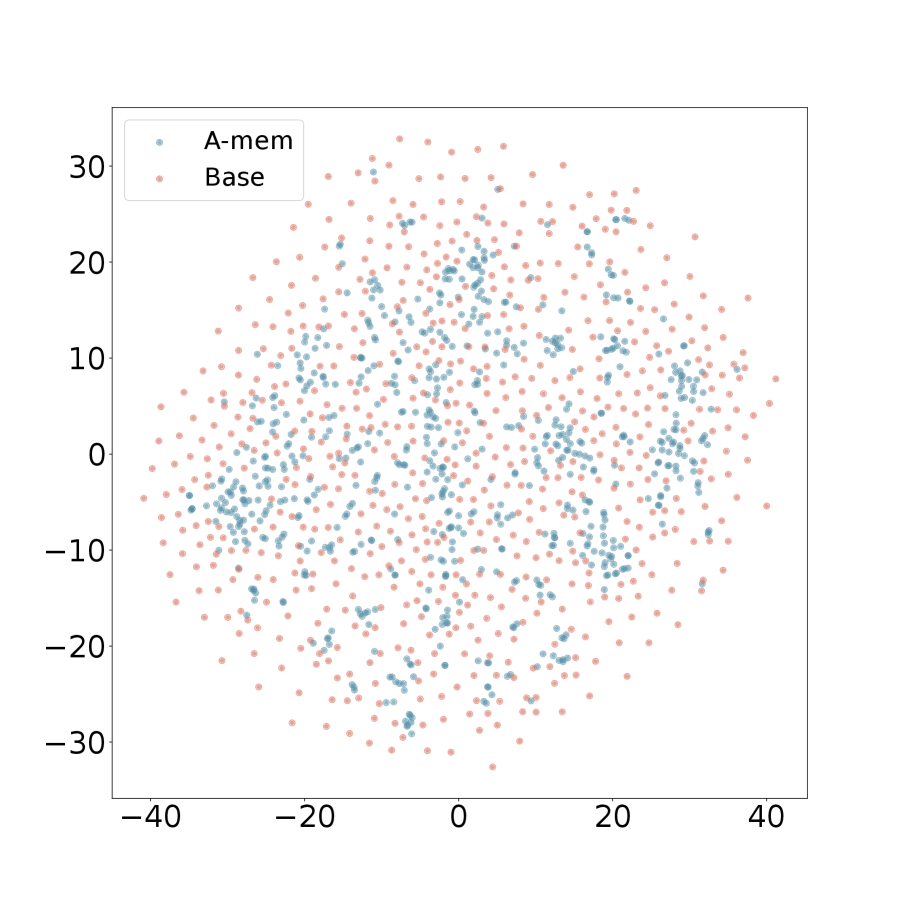
- **X-axis**: Ranges from -40 to 40, labeled with integer increments of 10.
- **Y-axis**: Ranges from -30 to 30, labeled with integer increments of 10.
- **Data Points**:
- **A-mem**: Blue circular markers.
- **Base**: Red circular markers.
## 2. **Legend**
- **Location**: Top-left corner of the plot.
- **Labels**:
- `A-mem` (blue).
- `Base` (red).
## 3. **Visual Trends**
- **A-mem (Blue)**:
- **Concentration**: Higher density of points clustered around the origin (0, 0).
- **Spread**: Points extend moderately outward but remain relatively centralized.
- **Trend**: Central tendency with moderate dispersion.
- **Base (Red)**:
- **Concentration**: Lower density near the origin; points are more uniformly distributed across the plot.
- **Spread**: Points extend to the edges of the plot (e.g., near ±40 on the x-axis and ±30 on the y-axis).
- **Trend**: Uniform dispersion with no clear central clustering.
## 4. **Spatial Grounding**
- **Legend Placement**: Top-left corner (coordinates: [x=0, y=30] relative to the plot's coordinate system).
- **Data Point Validation**:
- Blue points (A-mem) match the legend's "A-mem" label.
- Red points (Base) match the legend's "Base" label.
## 5. **Component Isolation**
- **Main Chart**: Scatter plot occupying the central region of the image.
- **Legend**: Isolated in the top-left corner, separate from the data points.
- **No Additional Components**: No headers, footers, or secondary axes present.
## 6. **Data Extraction**
- **A-mem (Blue)**:
- Example Points:
- (-10, 5), (0, 0), (15, -20), (-25, 10).
- **Pattern**: Central clustering with radial dispersion.
- **Base (Red)**:
- Example Points:
- (-35, -25), (30, 20), (-10, 30), (40, -10).
- **Pattern**: Edge-oriented distribution with minimal central overlap.
## 7. **Conclusion**
The plot compares two datasets (`A-mem` and `Base`) using a scatter plot. `A-mem` exhibits a central clustering pattern, while `Base` shows a more uniform distribution across the plot's range. No textual data tables or non-English content are present.