\n
## Diagram: Phase Diagram Representation
### Overview
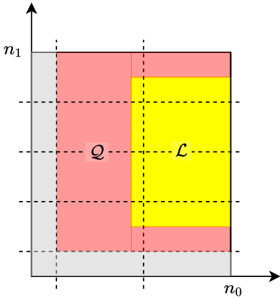
The image depicts a two-dimensional diagram representing a phase space or a region divided into different phases. The diagram uses color-coding to distinguish between different regions, labeled 'Q' and 'L'. The axes are labeled 'n₀' and 'n₁'. The diagram appears to illustrate a conceptual partitioning of a space based on two variables.
### Components/Axes
* **Axes:**
* Horizontal axis: labeled 'n₀'
* Vertical axis: labeled 'n₁'
* **Regions:**
* Yellow region: Labeled 'L' in the center-right.
* Pink/Red region: Labeled 'Q' in the center-left.
* Gray region: Surrounding the pink and yellow regions, forming a border along the axes.
* **Grid:** Dashed lines create a grid pattern within the diagram, dividing the regions into smaller squares.
### Detailed Analysis or Content Details
The diagram shows a rectangular area defined by the axes n₀ and n₁. The area is partitioned into three distinct regions:
* **Region Q (Pink/Red):** Occupies the left half of the rectangle. It is further divided into 9 equal squares by the dashed grid lines.
* **Region L (Yellow):** Occupies the right half of the rectangle. It is also divided into 9 equal squares by the dashed grid lines.
* **Gray Region:** Forms a border around the pink and yellow regions, extending along the n₀ and n₁ axes. This region appears to represent a boundary or transition zone.
There are no numerical values provided on the axes, so the scale and range of n₀ and n₁ are unknown. The diagram is purely qualitative, illustrating the relative positions and areas of the different regions.
### Key Observations
* The diagram visually represents two distinct phases, 'Q' and 'L', separated by a boundary.
* The areas of regions 'Q' and 'L' appear to be equal, each occupying approximately half of the total area.
* The gray region suggests a transition or boundary between the two phases.
* The grid lines indicate a uniform partitioning of the space within each phase.
### Interpretation
This diagram likely represents a phase diagram in a physical or chemical system. The variables n₀ and n₁ could represent concentrations, temperature, pressure, or other relevant parameters. The regions 'Q' and 'L' represent different phases of the system, and the gray region represents a phase boundary where the two phases coexist.
The equal areas of 'Q' and 'L' might suggest that the two phases are equally probable or stable under the conditions represented by the diagram. The grid lines could indicate a discrete or quantized nature of the system.
Without further context, it is difficult to determine the specific meaning of the diagram. However, it clearly illustrates a partitioning of a space into different phases based on two variables. The diagram is a conceptual representation and does not provide any quantitative data. It is a schematic illustration of a system's state space.