## Heatmap/Diagram: Partitioned Grid with Colored Regions
### Overview
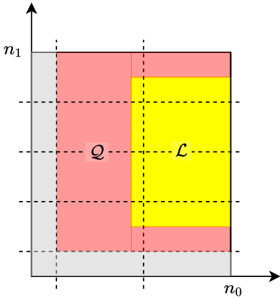
The image depicts a partitioned grid with two distinct colored regions labeled **Q** (red) and **L** (yellow), separated by dashed vertical and horizontal lines. The grid is bounded by axes labeled **n₀** (horizontal) and **n₁** (vertical), with no explicit numerical scale provided. A legend in the top-right corner associates colors with labels.
### Components/Axes
- **Axes**:
- **n₀**: Horizontal axis, labeled at the bottom-right corner.
- **n₁**: Vertical axis, labeled at the top-left corner.
- **Legend**:
- **Red**: Labeled **Q** (top-left region).
- **Yellow**: Labeled **L** (bottom-right region).
- **Grid Structure**:
- Dashed vertical lines divide the grid into three vertical sections.
- Dashed horizontal lines divide the grid into five horizontal sections.
### Detailed Analysis
1. **Region Q (Red)**:
- Occupies the leftmost vertical section (n₀ ≈ 0 to 0.6).
- Spans horizontally from n₁ ≈ 0.2 to 0.8.
- Includes a small yellow "L" region embedded within its lower-right quadrant.
2. **Region L (Yellow)**:
- Occupies the rightmost vertical section (n₀ ≈ 0.6 to 1).
- Spans horizontally from n₁ ≈ 0.2 to 0.8.
- Overlaps with the red "Q" region in its upper-left quadrant.
3. **Gray Borders**:
- Thin gray regions occupy the outermost edges of the grid (n₀ ≈ 0–0.1 and n₀ ≈ 0.9–1; n₁ ≈ 0–0.1 and n₁ ≈ 0.9–1).
### Key Observations
- **Overlap**: The yellow "L" region partially overlaps with the red "Q" region in the lower-right quadrant of Q.
- **Spatial Distribution**:
- Q dominates the left side of the grid.
- L dominates the right side but is constrained vertically between n₁ ≈ 0.2 and 0.8.
- **Legend Consistency**: Colors in the legend (red for Q, yellow for L) match the regions in the grid.
### Interpretation
This diagram likely represents a spatial partitioning of a system or dataset into two primary categories (**Q** and **L**), with overlapping regions suggesting potential interactions or dependencies. The absence of numerical values on the axes implies the focus is on categorical or qualitative relationships rather than quantitative measurements. The embedded "L" within "Q" could indicate a hierarchical or nested relationship between the two categories. The gray borders may represent boundaries or thresholds outside the primary operational range of Q and L.