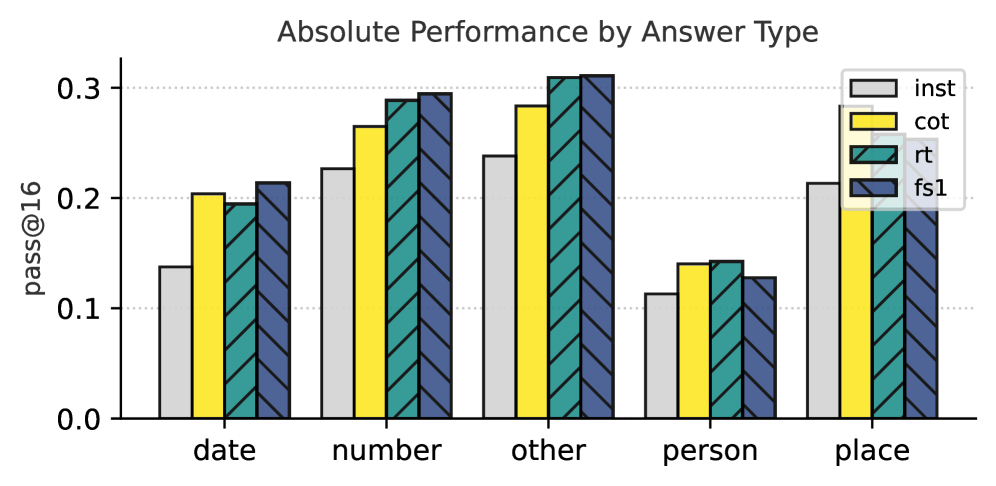
## Bar Chart: Absolute Performance by Answer Type
### Overview
The chart visualizes the absolute performance (measured as "pass@16") across five answer types: **date**, **number**, **other**, **person**, and **place**. Four answer subtypes are compared: **inst** (gray), **cot** (yellow), **rt** (teal), and **fs1** (blue). Performance values range from 0.0 to 0.3 on the y-axis.
### Components/Axes
- **X-axis**: Answer types (**date**, **number**, **other**, **person**, **place**).
- **Y-axis**: Performance metric (**pass@16**), scaled from 0.0 to 0.3.
- **Legend**: Located in the top-right corner, mapping colors to answer subtypes:
- **inst**: Gray
- **cot**: Yellow
- **rt**: Teal
- **fs1**: Blue
- **Bars**: Grouped by answer type, with each subgroup representing an answer subtype.
### Detailed Analysis
1. **Date**:
- **inst**: ~0.14
- **cot**: ~0.20
- **rt**: ~0.20
- **fs1**: ~0.21
2. **Number**:
- **inst**: ~0.23
- **cot**: ~0.27
- **rt**: ~0.29
- **fs1**: ~0.30
3. **Other**:
- **inst**: ~0.24
- **cot**: ~0.29
- **rt**: ~0.31
- **fs1**: ~0.31
4. **Person**:
- **inst**: ~0.11
- **cot**: ~0.14
- **rt**: ~0.14
- **fs1**: ~0.13
5. **Place**:
- **inst**: ~0.21
- **cot**: ~0.20
- **rt**: ~0.20
- **fs1**: ~0.19
### Key Observations
- **Highest Performance**: The **other** category consistently shows the highest values across all answer subtypes (~0.24–0.31).
- **Lowest Performance**: The **person** category has the lowest values (~0.11–0.14).
- **Trends**:
- **inst** (gray) generally underperforms compared to other subtypes, except in **person**.
- **cot** (yellow) and **rt** (teal) show similar trends, with **rt** slightly outperforming **cot** in most categories.
- **fs1** (blue) exhibits the highest performance in **number** and **other** but drops in **person** and **place**.
### Interpretation
The data suggests that **other** answer types are the most performant, potentially due to simpler or more structured patterns. **Person** answer types may involve greater complexity or ambiguity, leading to lower performance. The **fs1** subtype demonstrates robustness in **number** and **other** categories but struggles with **person** and **place**, indicating possible domain-specific limitations. The **inst** subtype’s lower performance across most categories highlights potential inefficiencies in its processing logic compared to other methods.