## Bar Chart: Absolute Performance by Answer Type
### Overview
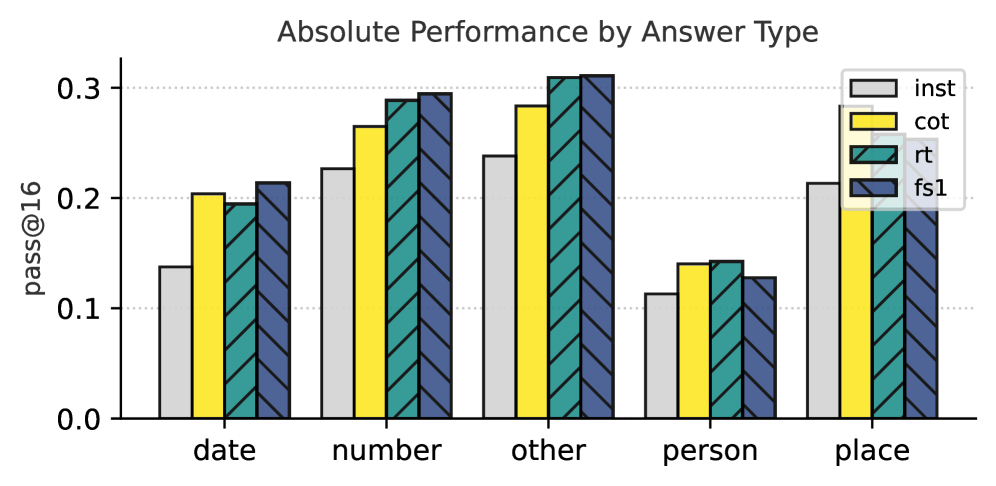
The image is a bar chart comparing the absolute performance (pass@16) of four different methods ("inst", "cot", "rt", and "fs1") across five answer types ("date", "number", "other", "person", and "place"). The y-axis represents the "pass@16" score, ranging from 0.0 to 0.3.
### Components/Axes
* **Title:** Absolute Performance by Answer Type
* **X-axis:** Answer Type (categories: date, number, other, person, place)
* **Y-axis:** pass@16 (scale: 0.0, 0.1, 0.2, 0.3)
* **Legend:** Located in the top-right corner.
* inst: Light gray bar
* cot: Yellow bar
* rt: Teal bar with diagonal stripes
* fs1: Dark blue bar with diagonal stripes
### Detailed Analysis
Here's a breakdown of the performance for each answer type and method:
* **Date:**
* inst: ~0.14
* cot: ~0.20
* rt: ~0.20
* fs1: ~0.21
* **Number:**
* inst: ~0.23
* cot: ~0.26
* rt: ~0.29
* fs1: ~0.29
* **Other:**
* inst: ~0.23
* cot: ~0.28
* rt: ~0.31
* fs1: ~0.31
* **Person:**
* inst: ~0.12
* cot: ~0.14
* rt: ~0.14
* fs1: ~0.13
* **Place:**
* inst: ~0.23
* cot: ~0.24
* rt: ~0.20
* fs1: ~0.20
### Key Observations
* The "other" answer type generally shows the highest performance across all methods.
* The "person" answer type consistently shows the lowest performance across all methods.
* "fs1" and "rt" methods tend to perform similarly and often outperform "inst" and "cot".
* The performance difference between methods is most pronounced for the "number" and "other" answer types.
### Interpretation
The chart illustrates the varying performance of different methods in answering questions based on the type of answer expected. The "other" category's high performance could indicate that the models are better at handling less specific or more varied types of information. Conversely, the lower performance on "person" questions might suggest difficulties in identifying and extracting information about individuals. The consistent outperformance of "fs1" and "rt" suggests that these methods are more effective overall in this context. The data suggests that the choice of method can significantly impact performance depending on the type of question being asked.